Candlestick analysis is a way to read the tug‑of‑war between buyers and sellers using the shape of individual candles and their combinations. It is popular in crypto because candles blend price and time in one unit and make market structure easier to see. This guide explains the parts of a candle, the most common patterns, and how to interpret them across timeframes. You will also see how to combine candles with volume, levels, and trend context, plus how these insights translate into execution choices when you compare top crypto exchanges, shortlist the best crypto exchange for your strategy, decide where to buy Bitcoin, plan a fiat to crypto exchange, or filter for reliable crypto exchangers with predictable costs.
Who this is for: newcomers taking first steps in technical analysis; traders who want a tidy ruleset for entries and exits; businesses that accept crypto and monitor markets before conversions.
A short history and the logic of candles
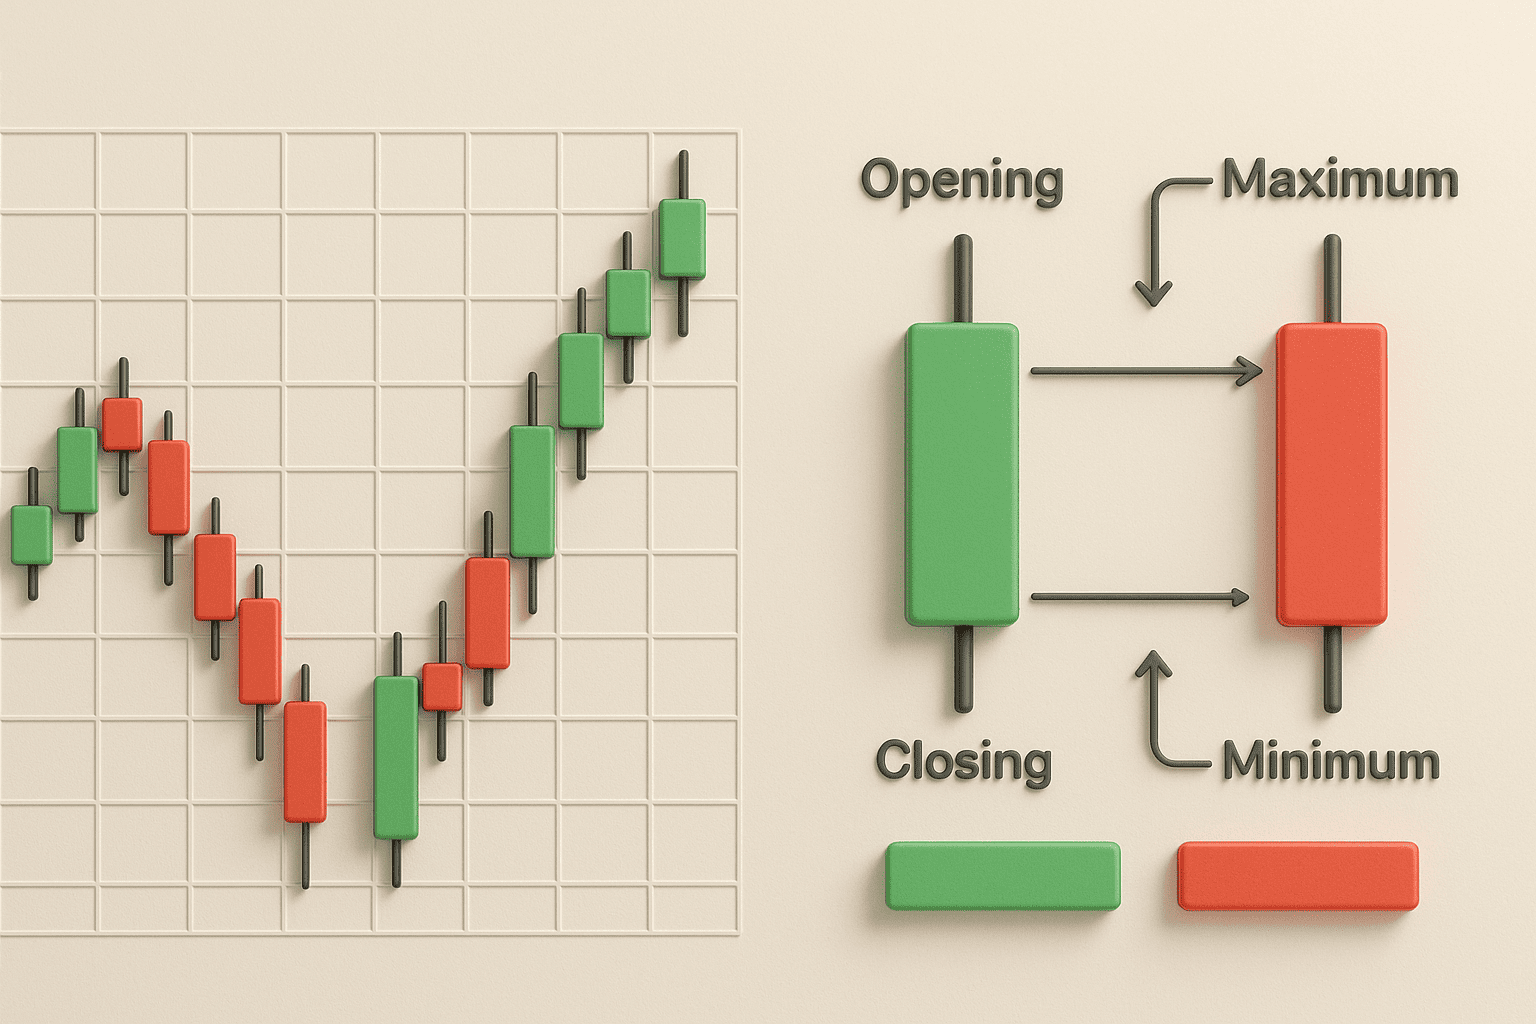
Japanese candlesticks date back to rice markets several centuries ago. One candle shows the open, high, low, and close (OHLC) for a chosen period. The body reflects the net move from open to close; wicks show rejected prices beyond the body. This makes candles more informative than a simple line and convenient for spotting impulses, rejections at levels, and reversals.
Anatomy of a candle
- Body: the distance between open and close. A long body points to strong momentum.
- Upper wick: the session high. A long top wick often signals rejection of higher prices.
- Lower wick: the session low. A long bottom wick often signals dip buying.
- Color: a convenient marker of direction. Context of body and wicks matters more than color alone.
Core single‑candle types
- Hammer and Hanging Man: small body with a long lower wick. In an uptrend, a hammer after a pullback confirms bids; a hanging man near highs is a caution.
- Pin bar: a long wick and a small body indicating a sharp rejection of price.
- Doji: tiny or no body. The market is undecided; wait for confirmation.
- Marubozu: no wicks; powerful impulse. Works well in the direction of trend.
Classic two‑ and three‑candle patterns
- Engulfing (bullish/bearish): the second candle fully covers the first body; marks a momentum shift.
- Piercing Line and Dark Cloud Cover: contextual buy‑the‑dip/sell‑the‑rip signals after gaps or strong candles.
- Harami: a small body inside the previous candle; often a pause that can turn into a reversal.
- Three White Soldiers/Three Black Crows: a series of candles in one direction that highlights trend strength.
- Morning/Evening Star: reversal combinations that work best around important levels.
Timeframes and why they matter
The meaning of a candle changes with the timeframe. Higher timeframes give fewer but more reliable signals; lower timeframes give more signals and more noise. For position and swing trading, 4H/1D/1W are common. For day trading, 5–15m/1H with 4H confirmation are typical.
Candle + level + volume: the three pillars of interpretation
Read candle signals in the context of support/resistance and volume dynamics. A hammer at support with rising volume is more meaningful than the same hammer in the middle of a range on weak volume. High‑quality signals combine:
- a test or retest of a level,
- a candle reaction with a clear invalidation point,
- volume confirmation and alignment with the higher‑timeframe trend.
Table 1. Key patterns and quick interpretation
| Pattern | What it implies | Stronger when | Caution |
|---|---|---|---|
| Hammer | Rejection of lower prices, dip buying | At support with elevated volume | Weaker in mid‑range without volume |
| Hanging Man | Caution after an advance | Near historical resistance | Needs confirmation by the next candle |
| Engulfing | Momentum shift | At a level, aligned with trend | Thin markets can produce traps |
| Doji | Indecision | After an extended trend or at a level | Avoid trading it without confirmation |
| Three White Soldiers | Persistent buying pressure | After accumulation in a range | Overbought risk; expect pullbacks |
| Three Black Crows | Persistent selling pressure | After distribution under resistance | Oversold risk; expect bear traps |
| Harami | Pause, potential reversal | At key levels | Often leads to chop rather than impulse |
Frequent mistakes
- Trading a pattern without level and volume context.
- Searching for a “perfect” candle instead of a ruleset.
- Ignoring timeframe alignment and the higher‑timeframe trend.
- Cluttering charts with many contradictory indicators.
- No invalidation point or exit plan.
Candles in crypto: special considerations
- Volatility: minute charts are noisy; test the idea on 1H/4H.
- Liquidity: thin books create long wicks; large tickets need deep order books.
- News: listings, releases, and network updates can distort patterns.
- Stable pairs: easier to analyze and execute via USDT exchangers.
Table 2. Reliability and conditions for success
| Pattern | Baseline reliability | What improves it | What reduces it |
|---|---|---|---|
| Hammer/Hanging Man | Medium | Level + volume + confirmation | Thin market, strong news against the setup |
| Engulfing | Above medium | Aligned with trend, at a retest | No volume, mid‑range entry |
| Doji | Low | Higher timeframe + level | Flat conditions without catalysts |
| Morning/Evening Star | Medium | Confluence with Fibonacci/channel | Against a strong trend without confirmation |
From pattern to trade plan
- Define context: trend status, nearby levels, upcoming news.
- Describe the setup: entry conditions, invalidation, scenarios.
- Size the risk: stop‑loss, target, position size using ATR or another volatility measure.
- Plan execution: venue, funding/withdrawals, and all‑in cost (fee + spread + network).
- Place a test trade and keep a journal with annotated screenshots.
Practical examples
Example 1. Hammer at support with rising volume
After a pullback, a hammer forms at a daily level and volume climbs above the 20‑period average. Plan: enter on a retest of the hammer body midpoint, stop below the low, target the prior high.
Example 2. Bullish Engulfing on a retest of broken resistance
Price breaks out and returns to the level; a bullish engulfing forms on 4H. The signal improves if the higher timeframe trend is up and volume expands during formation.
Example 3. Doji at a trend peak with no confirmation
A doji alone is weak. If the next candle does not confirm reversal, prefer trend continuation and avoid fighting the move.
How this helps you choose a place to execute
Candle signals hint at the type of execution you need. For quick impulses, speed and spreads matter; for position ideas, total cost and predictable withdrawals matter. This directly affects how you evaluate top crypto exchanges and reliable crypto exchangers, where to buy Bitcoin with your payment rail, and which USDT exchangers fit. When comparing options, focus on the truly low exchange fee path in an all‑in calculation rather than promotional rates.
Pre‑trade checklist
- Context on a higher timeframe; marked levels; relevant news.
- A candle signal with a clear invalidation point.
- Confirmation via volume and, optionally, a second factor (RSI/MACD/Bollinger Bands).
- Execution route: match the best crypto exchange to your pair and payment method; estimate total cost.
- Exit plan: partial take‑profits and a rule for moving the stop to breakeven.
Extended patterns and interpretation nuances
Beyond the basics, watch for inside bars as a volatility‑compression cue; “failed pin bars” where price is sharply pushed the other way; and “railway tracks” as a visual cousin of engulfing. Do not confuse brief liquidity grabs with real reversals — judge candle closes relative to levels and how price behaves on the retest.
Candles around news and pseudo‑gaps
Crypto trades 24/7, so classical gaps are rare, but news can create extreme bodies and wicks. Risk management comes first: reduce size, wait for confirmation, and avoid chasing spikes.
Combining candles with moving averages and oscillators
- EMA 50/200 + a candle at a level: a classic direction filter.
- RSI divergence + a pin bar at support: increases rebound odds.
- Bollinger Bands + a hammer near the lower band after a squeeze: hints at impulse start.
Multi‑timeframe workflow
Work top‑down: first mark trend and key zones on a higher timeframe, then drop to a working timeframe for signals and a lower one for precise entries. This reduces false trades and keeps setups aligned with context.
Case studies
Case A: Bullish Engulfing on a daily level after a three‑day decline
After a sequence of selloffs, price prints an engulfing right on a prior accumulation zone. Volume is above average. Plan: enter on a retest of the mid‑body, stop below the low, first target at the local high, then trail.
Case B: Hanging Man under historical resistance with falling volume
Price approaches resistance and forms a small‑body candle with a long lower wick. The next period brings no confirmation. Outcome: skip the short until sellers show pressure or a breakout and hold above the level.
Case C: Trendline + pin bar + RSI divergence
On a 4H chart, price tests an ascending trendline, prints a pin bar with a long lower wick, and RSI makes a higher low. This confluence allows a tight‑risk entry.
Entry and exit strategies built on candles
- Enter on a retest of 50% of a reversal candle’s body.
- Pyramid on follow‑through candles in the trend direction.
- Take partial profits at prior swing points and trail stops below/above candle lows/highs.
Operational aspects of execution
To implement an idea, estimate spread and fees. For fast reactions you need low latency and quick funding. For larger tickets you need deep books and transparent costs. When comparing venues in a listing, calculate total cost: trading fee, spread, network costs, and any conversion. That is how you find the best crypto exchange for your trading style and size, and how you decide where to buy Bitcoin without hidden costs.
Glossary
- OHLC — open, high, low, close values.
- Retest — a return to a broken level to verify its new role.
- Liquidity sweep — a brief push beyond a level followed by a quick return.
- Invalidation — a condition after which the trade idea is considered wrong.
Extra tables
| Situation | What to check | Action |
|---|---|---|
| Candle at a level without volume | Compare to the 20‑period volume average | Wait for confirmation or skip |
| Breakout with a long wick | Was there a sweep and quick return? | Look for an entry back into the range |
| Series of trend marubozu | RSI status; distance to key resistance | Take partials and trail stops |
Risk management by the numbers
- Per‑trade risk: 0.5–2% of equity, depending on strategy.
- Stop‑loss beyond the reversal candle’s wick or the local extreme.
- Position size = Risk in currency / Stop distance.
Workspace tips
- Separate layouts for higher timeframe, working view, and execution view.
- Minimal indicators, maximal clarity. Two or three quality signals are enough.
- Keep templates for level markup and reusable pre‑trade checklists.
Extended FAQ
Should I trade during major news?
You can, but volatility and slippage rise. Reduce size, wait for candle closes, and only trade with a clear invalidation.
What if a pattern appears against the higher‑timeframe trend?
Either skip it, or cut risk and seek stronger confirmation: a second signal, clear volume expansion, or a level close above/below.
How often do “perfect” candles occur?
Rarely. Trade quality is driven more by execution discipline, risk control, and journaling than by ideal shapes.
How can I code candle rules?
Formalize ratios (body/wick), level proximity, and volume filters; then backtest and forward‑validate with fixed rules.
Pre‑trade playbook
- Context: trend on the higher TF, levels, news, volatility.
- Signal: the exact pattern and where it occurs.
- Confirmation: volume, retest, or a second factor.
- Execution: pick a venue with low latency, convenient funding, and transparent fees.
- Risk: stop, size, partial exits.
Comparison table: venues by trading style
| Style/Task | What matters most | What to look for |
|---|---|---|
| Scalping and fast impulses | Low latency, tight spreads | Deep books, fast on‑ramps, robust APIs |
| Swing trading on daily charts | Low total cost of ownership | Maker/taker discounts, predictable withdrawals |
| Fiat → crypto | Simple deposits and local rails | Fiat to crypto exchange options with clear rates |
| Stable pairs | Liquidity and minimal slippage | USDT exchangers and deep stablecoin markets |
Deep dive examples
Example 4. Inside bar breakout after a squeeze
After several narrow candles, an inside bar forms at support. A breakout with volume confirms. Entry on the retest of the inside bar, stop below its low, target the midpoint of the prior range.
Example 5. Failed pin bar and reversal
A bearish pin bar prints under resistance but price closes back above the high on rising volume. Treat the pin as failed and look for a continuation setup in the new direction.
Example 6. Railway tracks at a key level
Two long opposite candles of similar size at resistance signal aggressive disagreement. Use the next close to confirm the side, then trade the retest with tight risk.
Process and discipline
- Save before/after screenshots with notes about context and triggers.
- Standardize your journal: pattern, context, trigger, risk, outcome, lessons.
- Use alerts for levels and candle combinations to avoid screen fatigue.
Conclusion
Candlestick analysis is a simple yet deep way to read the market. It works best in tandem with levels, volume, trend, and disciplined risk. Choose a timeframe that fits your strategy, look for confluence, and plan execution with costs and liquidity in mind. This makes it easier to compare options via a curated listing, evaluate top crypto exchanges, pick the best crypto exchange for your needs, decide where to buy Bitcoin efficiently, and rely on reliable crypto exchangers with transparent terms. For stable pairs, consider USDT exchangers and keep the total route cost under control to stay on a genuinely low exchange fee path.