A bubble isn’t a “new normal” — it’s a temporary illusion of sustainable growth fueled by cheap leverage, surplus optimism, and social-media narratives. In crypto, where fundamentals are still forming, waves of euphoria and panic can arrive faster than on traditional markets. This guide gives you crisp warning signs, market and on‑chain indicators, practical checklists, and antidotes so you aren’t the last buyer at the top.
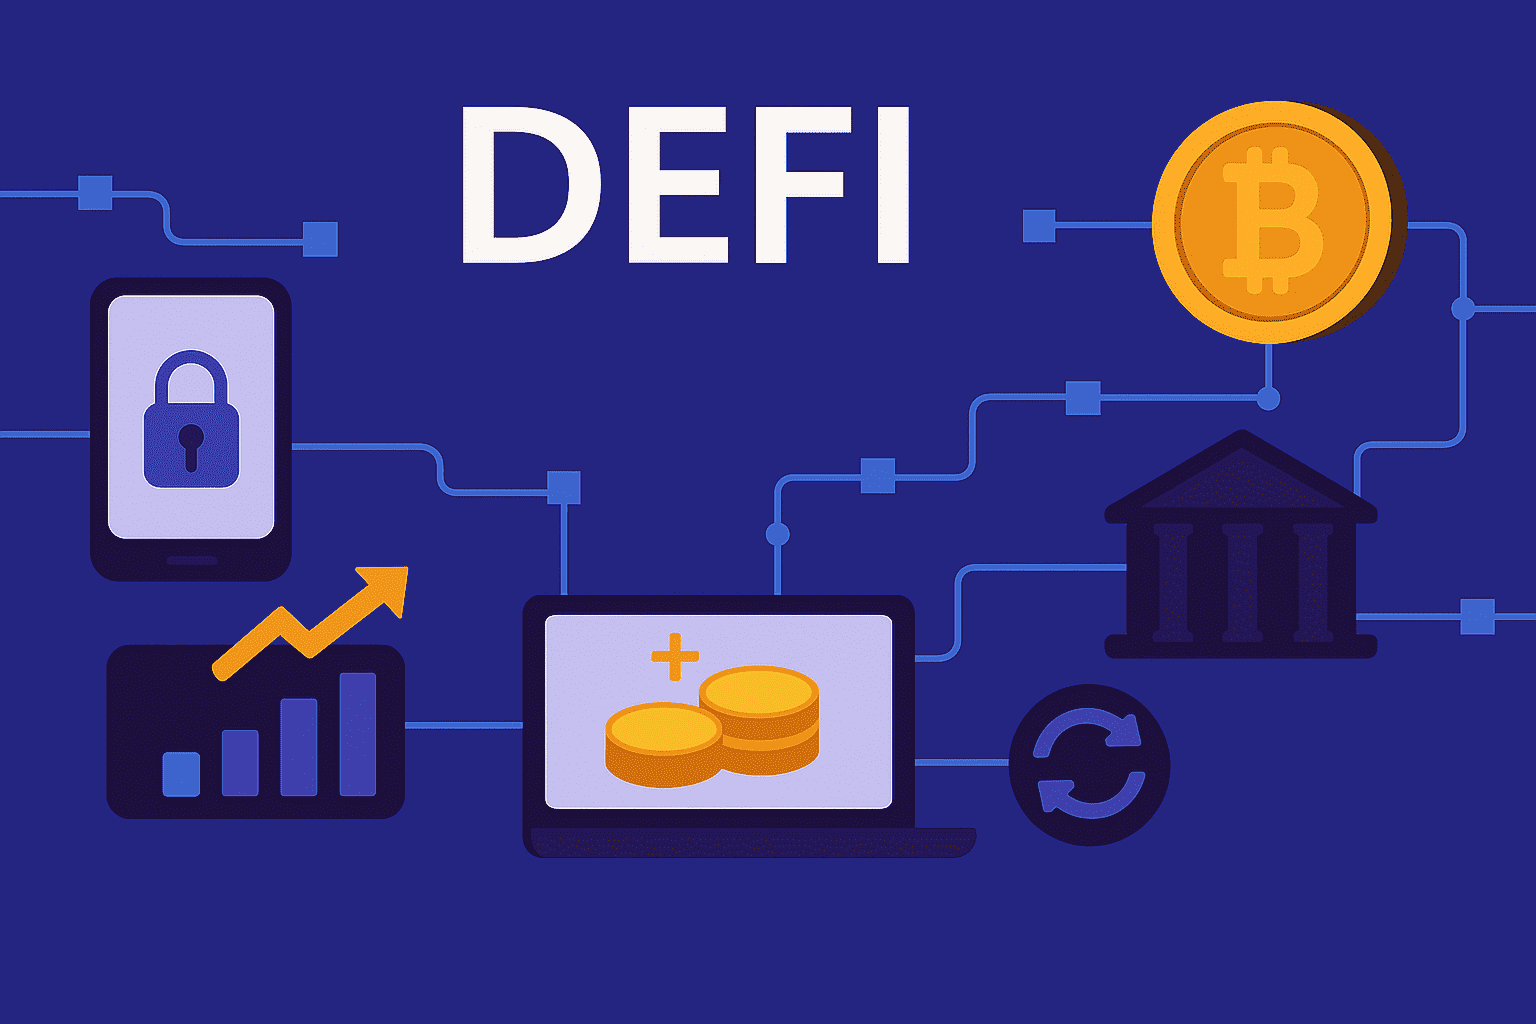
How to Spot Cryptocurrency Bubbles and Avoid Getting Caught
At a glance: the bubble signal map
| Signal | What it looks like | Verification | Possible action |
|---|---|---|---|
| Parabolic ascent | Long candles without pullbacks, near-vertical trends | Count impulse candles; distance from MAs/ATR bands | Take partials; forbid “chasing” with market orders |
| Overheated derivatives demand | Elevated funding, long skew, OI explosion | Funding > 0.1%/8h; OI rising faster than spot | Cut leverage; plan exits; avoid perpetuals |
| Social hype and “risk‑free” promises | “To the moon” memes, guaranteed APY, leader cult | Source? Evidence? Are risks discussed at all? | Fact‑check; no market buys; take a pause |
| Tokenomics imbalance | Tiny float with high FDV; early unlock schedules | Emission curve; unlock calendar; VC share | Avoid/hedge; operate only from clear zones |
| On‑chain divergence | Price up while activity/addresses don’t confirm | MVRV, SOPR, active addresses, exchange netflow | Reduce exposure; rotate partly into stables |
Key idea: a bubble isn’t just price — it’s a combination of behavioral and structural signals.
What a bubble is: a simplified Minsky model
Economist Hyman Minsky outlined five phases: displacement (new narrative/tech), boom (easy credit, capital inflow), euphoria (parabolic rallies, “new paradigm”), profit taking (smart money exits), and panic (forced liquidations, cascade selling). In crypto these phases can play out in months — sometimes weeks.
Practice: map your asset to a phase and adapt tactics: in boom — more aggressive entries with stops; in euphoria — cut risk; in profit taking — stage exits; in panic — pause or use countertrend plans.
Market and derivatives indicators of overheating
- Funding and futures/perps basis: persistent positive funding and a basis premium signal levered long dominance — fuel for painful flushes.
- Open interest (OI): when OI rises faster than spot and cumulative delta turns sharply positive, liquidation risk climbs.
- Options skew: call dominance and elevated implied volatility point to “rocket” expectations.
- Spreads and depth: at euphoria peaks, spreads widen and thick ask walls disappear.
Caution: single metrics can mislead. Look for a confluence of independent signs.
On‑chain markers: when the network doesn’t support the price
- MVRV and SOPR: high MVRV with SOPR > 1 for long stretches suggests unrealized profit dominance — late buyers risk becoming “exit liquidity.”
- Active addresses and tx counts: if activity fails to rise with price, the narrative may be hollow.
- Exchange netflows: inflows during rallies hint at near‑term sell pressure.
- Whale behavior: outflows from long‑term wallets into exchanges near peaks are classic distribution.
Tokenomics and primary offerings: where risk hides
- FDV vs float: a lofty fully‑diluted valuation with a tiny float creates the illusion of “expensiveness” on minimal volume — perfect pump soil.
- Unlock schedules: large cliffs for funds/team often align with local tops and intensify sell pressure.
- Emission & inflation: incentive/farming programs may boost TVL short‑term but dilute price over time.
- Utility: without real usefulness a token is narrative‑only; identify who benefits from emissions.
Tip: before entry, seek the whitepaper, emission curve, unlock calendar, allocation split, and reward mechanics. If these data don’t exist — red flag.
Behavioral traps that feed bubbles
- FOMO and herding: “everyone already made money” → late entries at any price.
- Authority/halo: blind trust in celebrity founders, influencers, or funds.
- Recency effect: projecting the latest gains into the future.
- Confirmation bias: filtering out counterarguments and risks.
Checklist: “this might be a bubble”
- Price is up X% in a week/month with barely any pullbacks.
- Funding stays positive; OI hits records; perps trade at a premium.
- Google Trends/social explode; the feed promises “no risk.”
- FDV high, float tiny; big unlocks close by.
- Network activity lags price; exchange inflows rise.
- Team/advisors lack transparent bios; documentation is thin.
- Utility unclear; APY/ROI promises look unrealistic.
If 3–4 boxes tick or more: cut exposure, switch to limits/partials, avoid leverage until metrics normalize.
Antidotes for traders
- Zones and alerts: enter only from pre‑marked levels; during euphoria use limits only.
- Fixed % risk: 0.25–1% per trade; size positions from stop distance, not confidence.
- Pause rule: two stops in a row → 30‑minute break; daily trade cap.
- Proactive de‑risking: partials into strength; trail stops instead of “hope.”
- Information hygiene: a whitelist of sources, fact‑check before acting, a “blacklist” of triggers.
Antidotes for investors
DCA with rebalancing: automation reduces emotion and timing errors.
Risk‑cut policy: max X% per asset/narrative; mandatory stablecoin reserve.
- Quality filters: utility, tokenomics, team, code audits, jurisdiction.
- Scenarios: base/optimistic/stress — what do I do at −30%, −50%, −80%?
- Action calendar: rebalance/review dates; “no‑decision” moratorium during hype peaks.
Decision map: what to do right now
| Situation | What to check | Decision | What not to do |
|---|---|---|---|
| Wild pump | Funding, OI, depth, zone alerts | Limits only in zones; partials; no averaging up | Emotion‑driven market long; adding leverage |
| Final euphoria | MA distance, Google Trends, social tone | Cut size/leverage; set a trail; take some off | Buy more “because everyone buys” |
| Sharp dump | Exchange inflows, liquidations, bids | Stage exits/hedges; stops by plan; pause | Pull stops; “fight back” with leverage |
| Noise accumulation | Divergence between on‑chain/derivs/spot | Reduce exposure; trade only “A+” setups | Drop to micro timeframes to “catch every tick” |
30‑day anti‑bubble hygiene plan
- Days 1–5: write one page of execution & risk rules; a separate “do‑not‑do” list.
- Days 6–10: set zone alerts, trade caps, and calendar breaks.
- Days 11–15: compile your bubble casebook (screens, metrics, lessons).
- Days 16–20: test partial‑exit and trailing‑stop strategies.
- Days 21–25: audit the portfolio: weights, correlations, narrative concentration.
- Days 26–30: create a fact‑checking checklist and an action map for team/partners.
Tiny habit: one short daily note: “what hints today that this is a bubble/not a bubble?” Consistency > perfection.
Myths vs. reality
| Myth | Reality |
|---|---|
| “In crypto everything always goes up.” | Markets are cyclical. Bubbles end with painful corrections and long consolidations. |
| “Early means safe.” | Without liquidity/tokenomics, “early” doesn’t save you from −90% on tiny floats. |
| “Big‑name funds mean no risk.” | VC unlocks can create sell pressure. Study the unlock schedules. |
| “Sentiment is enough for entry.” | Sentiment is context only. Entries/exits belong to your system. |
FAQ
- Can you profit from bubbles? Yes — if you have entry/exit plans, risk limits, and discipline. But loss risk is elevated.
- Simple overheating proxies? Persistently positive funding, OI explosions, perps premium to spot, Google Trends spikes, “risk‑free” promises.
- Does “sell greed” work? As a compass — yes; in practice use zones, position management, and risk control.
- What about tokens with high FDV? Track float and unlocks; avoid chasing; use limits or simply wait.
- Should I hedge? In peak euphoria, reduce leverage/size; consider partial hedges or staged exits.
- How much to keep in stables? Depends on risk profile; common range is 10–40% as a market “fire extinguisher.”
- Is a trading journal necessary? Yes. After 30–50 entries you’ll see your personal bubble triggers.
- How to tell hype from innovation? Innovation shows clear utility and an adoption path; hype is price‑ and promise‑driven.
- Is this financial advice? No. Educational material only; decide according to your risk profile.
Quantitative guideposts (beacons, not rules)
- Distance from means: price > 3–5× ATR/MA from average for weeks.
- Funding: stable > 0.1%/8h across several sessions — overheated levered longs.
- Perps premium: persistent perps premium to spot > 0.5–1% during peak hours.
- OI records: sharp OI growth while spot stalls.
- Google Trends: query peaks aligning with local price tops.
Treat these as comparisons to the asset’s own history, not universal “holy numbers.”
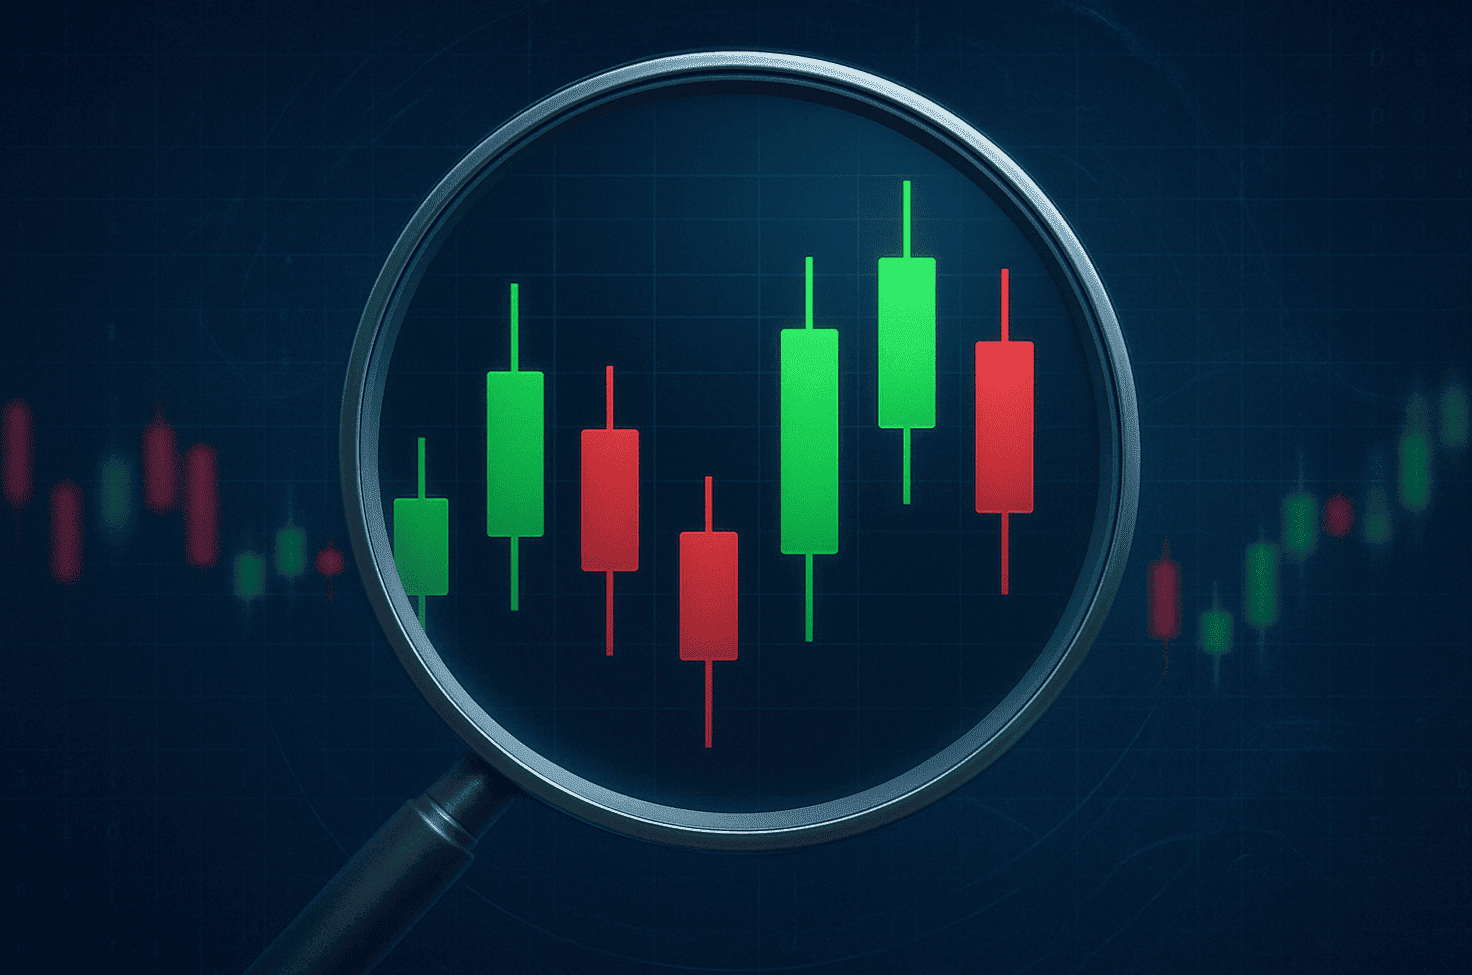
Chart patterns commonly seen around bubbles
- Climax run: multi‑day 10–20% candles without pullbacks; volume fades at the very top.
- Blow‑off top: tall wick and reversal on high volume.
- Distribution range: wide sideways ranges after the climax with “wicks up” to trigger liquidations.
- Dead‑cat bounces: brief 20–40% rebounds inside a downtrend — classic bull traps.
How to read news without becoming a victim of spin
- Separate facts (dated documents, regulator notices) from opinions and “anonymous sources.”
- Check context: does the news actually change cash flows/utility, or is it merely a retelling?
- Watch timing: do “bombshells” drop exactly around technical turning points?
- Maintain a source whitelist; avoid click‑bait and “we have insider info” channels.
Data: where to get it and how to cross‑check
- Derivatives: funding, OI, liquidations, skew — compare across several venues.
- On‑chain: active addresses, netflows, large transfers, coin age.
- Spot & depth: order book, spreads, side imbalance, liquidity clusters.
- Social signals: mention volumes, tone, reposts from reputable accounts.
- Correlations: align direction and strength across domains; act on confluence, not on a single indicator.
Patterns from past cycles (generalized)
Price rise without on‑chain support
Derivatives drive the rally while active addresses/txs lag — the unwind tends to be painful.
Low float + high FDV
A tiny circulating supply enables pumps until large VC unlocks arrive — then a long downtrend begins.
Hype around a “new category”
Memecoins/NFT/DeFi manias: strong early waves and long distribution as “smart money” rotates into stables/leaders.
Social‑media hygiene against manipulation
- Disable “all threads” notifications; follow 2–3 vetted sources.
- Keep a “blacklist” of triggers: “no risk,” “easy APY,” “friend’s insider.”
- Check the author’s track record: past errors/manipulation?
- Adopt “no night decisions” and 30‑minute pause rules.
Self‑reporting plan
- Weekly portfolio score: risks, correlations, narrative dependency.
- Top‑3/bottom‑3 decisions — what drove them?
- Update the bubble checklist and source whitelist.
Extra Q&A
- Are there “safe” bubbles? No. Only different awareness and exit discipline levels.
- When to start de‑risking? When multiple signals align and your rules allow it — better one candle early than one late.
- What about taxes on taking profits? Plan them in your jurisdiction — obligations are risks to manage too.
- Does averaging down work? In post‑bubble downtrends it often leads to capitulation. Wait for confirmations and zones.
- What horizon suits DCA? Long only — years, not weeks. With disciplined rebalancing.
Minimum rule‑set for beginners
- No “market buys” at emotional peaks; use limit orders at defined zones only.
- Risk per trade ≤ 1% of the portfolio; use leverage only with a clear plan and hedge.
- Before buying, read tokenomics, the unlock chart, and at least one critical review.
- Do a small weekly rebalance and one journal entry about how your risk changed and why.
Bottom line: spotting bubbles is about reading context, not “calling tops.” A blend of metrics, tokenomics, behavioral signals, and disciplined risk management helps you avoid being someone else’s exit liquidity — and navigate the next cycle stronger.