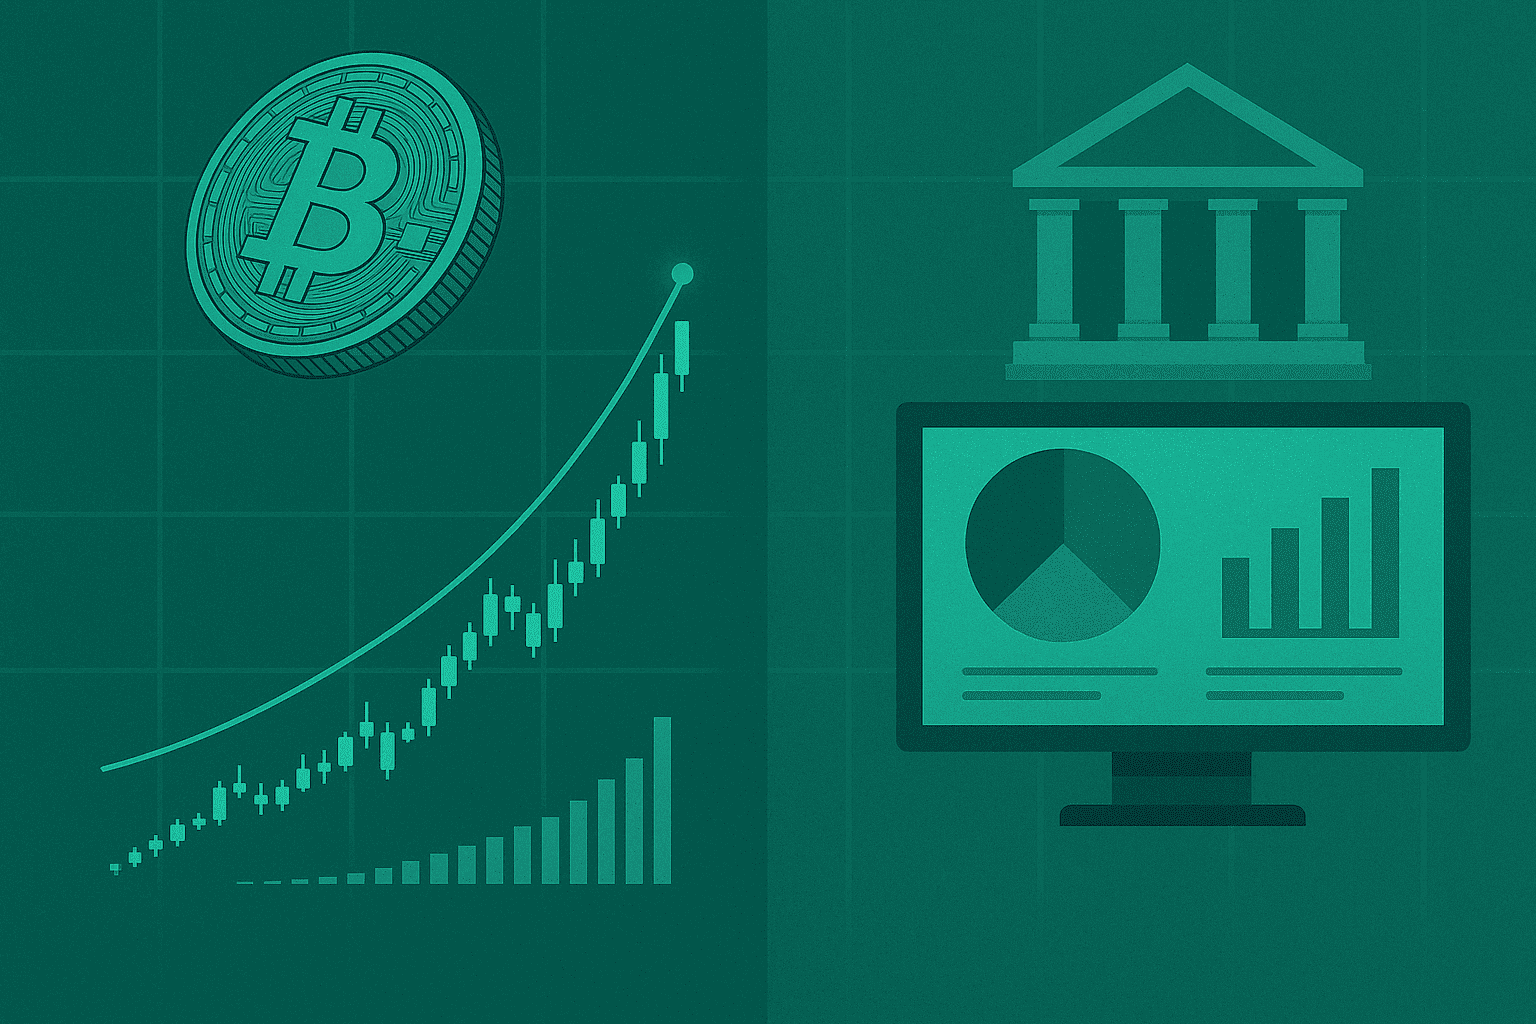
Cryptocurrency market capitalization is one of the most referenced concepts in digital asset analysis. At its core, market cap is the product of a token’s price and the number of coins in circulation. The idea is simple, but the interpretation is layered. Market cap helps rank assets by size, set expectations about liquidity, and frame portfolio construction. Yet it does not directly capture token unlocks, order book depth, fee structures, regulatory risk, or protocol sustainability. Used in isolation, it can mislead; used with complementary metrics, it becomes a powerful first filter when evaluating assets and choosing the best crypto exchanges for execution, the top exchange platforms by liquidity, or where to buy Bitcoin at the most efficient total cost.
The purpose of this guide is to give investors, traders, and researchers a rigorous, plain‑English reference for understanding market cap in crypto. We will walk through formulas, the differences between circulating, total, and max supply, why FDV (Fully Diluted Valuation) and free float matter, and how realized cap can better approximate economic value. We will also compare categories such as large‑cap, mid‑cap, and small‑cap assets, explore case studies for Bitcoin and Ethereum, and discuss how DeFi tokens, stablecoins, meme coins, and Layer‑2 networks fit into the picture. Finally, we will connect the metric to real‑world decisions: selecting reliable exchangers, optimizing fiat to crypto exchange routes, and minimizing total cost with USDT exchangers and low commission exchange options.
Basic formula: Market Cap = Price × Circulating Supply. The trick is to define supply correctly and interpret the number in context.
1. Historical context: how market cap entered crypto
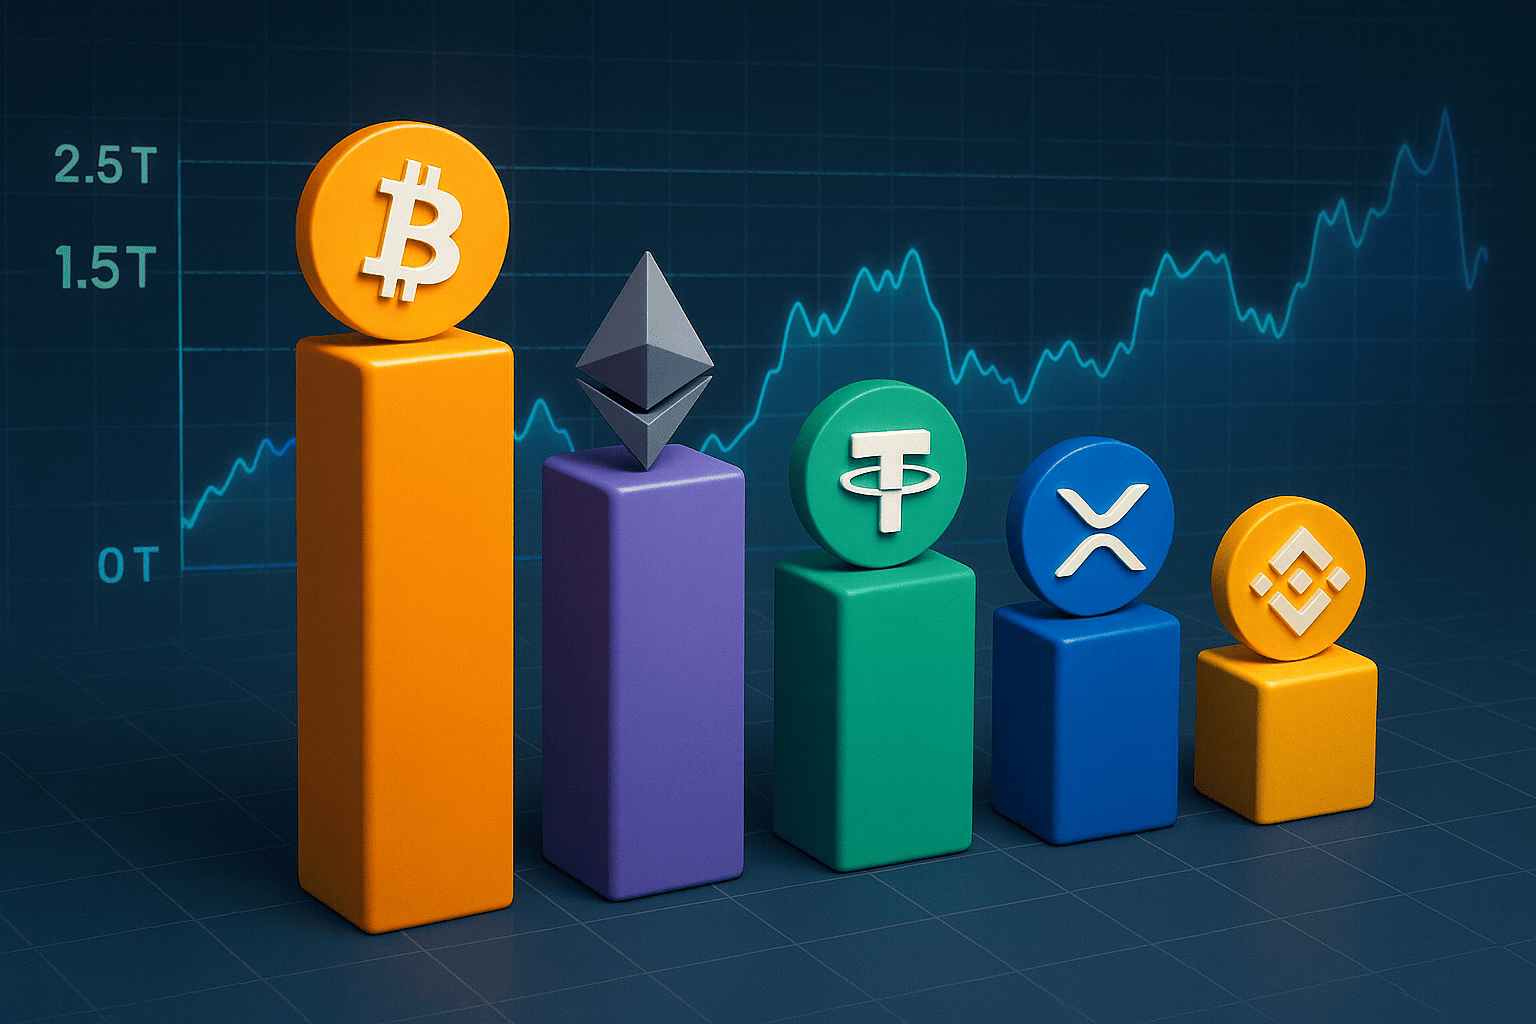
Market capitalization originates in equity markets, where it has long been used to classify companies into size buckets and to proxy for liquidity and risk. Crypto adopted the same vocabulary, though tokens behave differently from equities: supply schedules are programmable, unlocks can be steep, and distribution patterns vary widely. When Bitcoin first approached a $1 billion market cap in 2013, it signaled a new investable domain. The 2017 ICO cycle injected thousands of tokens into rankings. In 2021, total market capitalization exceeded $3 trillion on the back of institutional adoption, DeFi growth, and the NFT boom. The 2022 drawdown after the collapses of Terra/Luna and FTX showed that market cap can evaporate quickly when trust breaks. In 2024, the arrival of US‑listed Bitcoin ETFs brought new demand channels and renewed attention to the metric.
1.1 Timeline at a glance
| Year | Bitcoin Market Cap | Total Crypto Market Cap | Context |
|---|---|---|---|
| 2013 | ≈ $1B | ≈ $1.5B | Early exchange era, Mt.Gox boom‑bust |
| 2017 | > $300B | > $800B | ICO expansion, altcoin proliferation |
| 2021 | > $1T | > $3T | DeFi, NFTs, derivatives, institutional interest |
| 2022 | \< $500B | \< $1T | Terra/Luna collapse, FTX bankruptcy, deleveraging |
| 2024 | ≈ $850B | ≈ $2T | Bitcoin ETFs in the US, gradual regulatory clarity |
2. How market cap is calculated (and why the inputs matter)
The textbook formula is straightforward, but the operational details are not. Three supply measures are commonly referenced and each one changes interpretation.
- Circulating supply: coins that are freely tradable today. This is the standard input for market cap rankings.
- Total supply: all tokens that exist, including locked allocations and treasury funds.
- Max supply: the hard or programmatic upper limit on tokens defined by the protocol.
Confusing these terms can distort comparisons. A token with a tiny float and a steep unlock schedule can display a large market cap while behaving like an illiquid small‑cap in practice. That is why investors combine market cap with FDV, free float, daily volumes, and order book depth on specific trading venues.
2.1 Fully Diluted Valuation (FDV)
FDV is computed as Price × Max Supply. It represents the hypothetical valuation if all tokens were circulating. A large gap between market cap and FDV signals potential future sell pressure. To interpret FDV correctly, read the token unlock schedule (vesting cliff, linear unlocks, emissions), identify allocations to team and investors, and align the timeline with your holding horizon. If the largest unlocks land in the next six months while user demand is flat, the risk of price/headline pressure increases.
2.2 Free float
Free float refers to the percentage of supply that is not locked, pledged, or constrained by illiquidity. It is the closest proxy for the coins that can realistically hit the order book. Combine float with average daily volume and the depth at 1–2–5% from the mid price to gauge slippage risk on the venues you use. For execution, free float can be more informative than headline market cap.
2.3 Realized capitalization and complementary metrics
Realized cap values each coin at the price of its last on‑chain movement. It down‑weights dormant coins and better approximates the aggregate “economic cost basis” of holders. Other helpful indicators include transaction throughput, active addresses, validator revenue, issuance/burn dynamics, and in DeFi, TVL (Total Value Locked). The ratio of market cap to TVL offers a rough lens on whether a protocol’s valuation is aligned with capital actually parked in it.
3. Size buckets: large‑cap, mid‑cap, small‑cap
| Bucket | Indicative Range | Typical Liquidity | Common Trade‑offs |
|---|---|---|---|
| Large‑cap | Tens of billions USD | Deep books, tight spreads | Lower relative upside; macro sensitivity |
| Mid‑cap | $1–10B | Reasonable depth, wider spreads | Higher sensitivity to listings, narratives |
| Small‑cap | \< $1B | Thin books, intermittent liquidity | High volatility; risk of manipulation |
These ranges are conventions, not laws. What matters is how a token actually trades where you plan to execute. Always validate with order book data and fee schedules on your preferred venues.
4. What market cap captures well — and what it misses
| Good proxy for | Poor proxy for |
|---|---|
| Relative scale and rank | Actual order book depth on a given pair |
| Typical liquidity expectations | Token unlock timing and size |
| Portfolio bucketing | Protocol quality, product‑market fit |
| Rough volatility profile | Regulatory and operational risks |
In practice, market cap is the front door. The due‑diligence room behind it contains FDV, float, TVL, network health, ownership concentration, and, crucially, the execution conditions at the exchange you actually use.
5. Case studies and sector nuances
5.1 Bitcoin
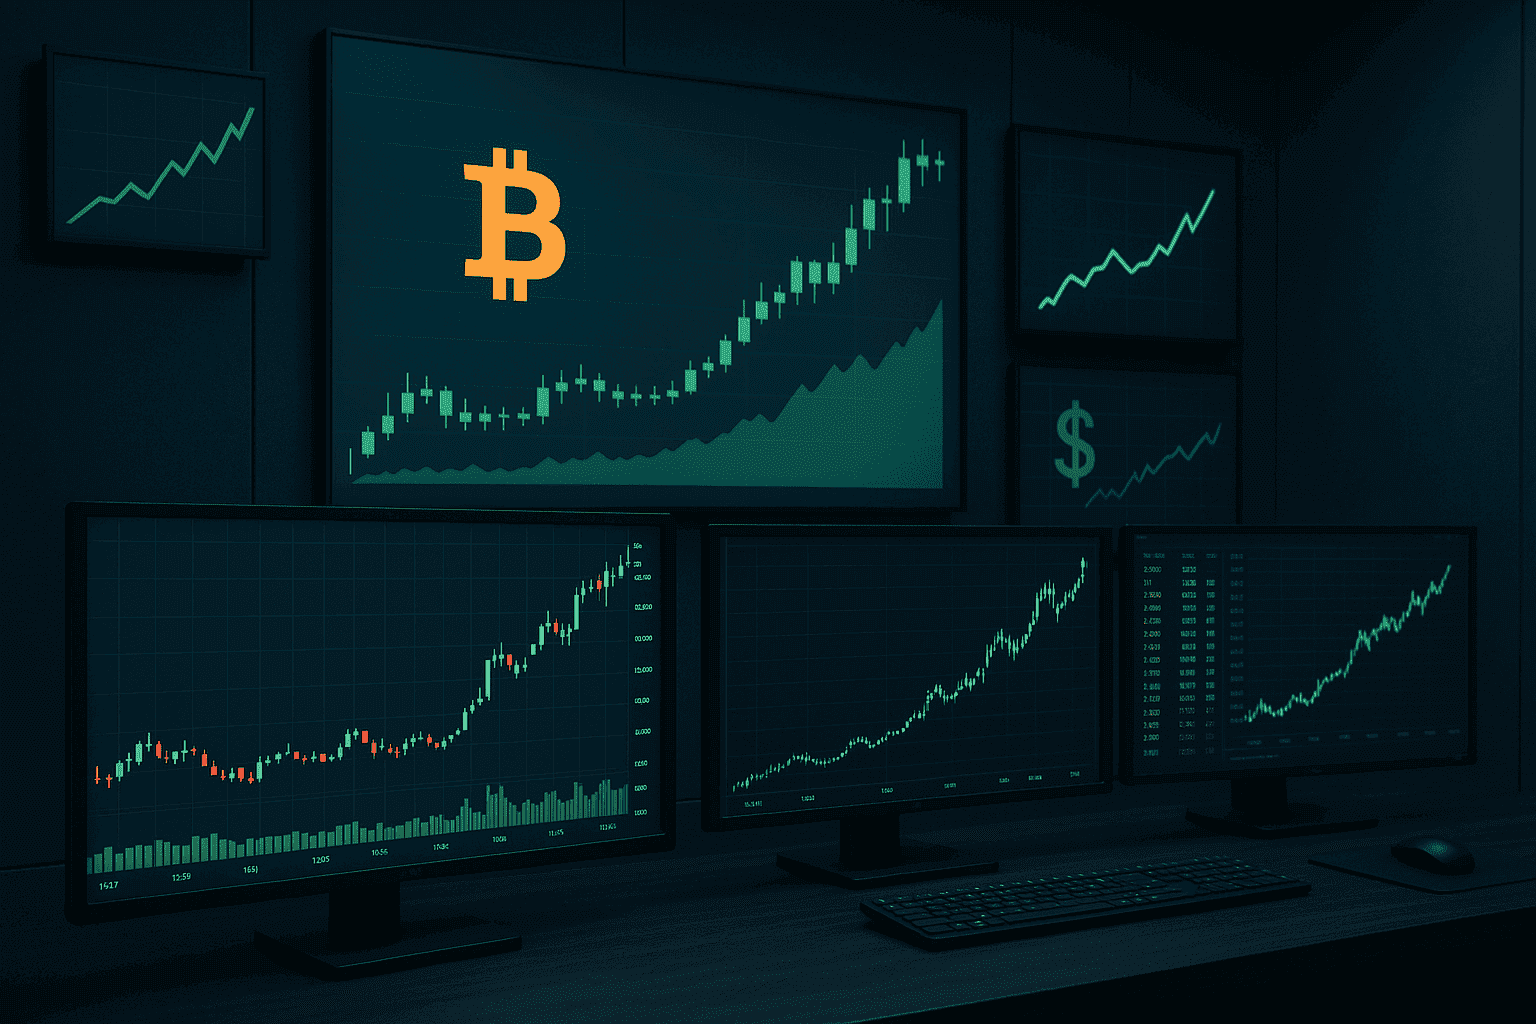
Bitcoin is the canonical large‑cap. Its market cap is distributed across numerous venues with deep books and sophisticated derivatives markets. For users comparing where to buy Bitcoin, the deciding factor is rarely the headline price alone; it is the total cost of the route: maker/taker fees, network fees, deposit and withdrawal times, and slippage. Reliable exchangers and USDT exchangers with low commission exchange options can reduce all‑in costs, especially for retail users moving between fiat on‑ramps and stablecoin rails.
Even with a massive market cap, Bitcoin responds to macro drivers such as interest‑rate expectations, ETF flows, and liquidity cycles. Large moves often cascade through derivatives liquidations. Market cap won’t shield you from those dynamics, but it does imply that, compared with small‑caps, Bitcoin usually offers tighter spreads and more predictable execution on top exchange platforms.
5.2 Ethereum
Ethereum sits in the top tier by market cap and underpins a vast smart‑contract ecosystem. Network upgrades, Layer‑2 adoption, validator economics, and blockspace demand all influence valuation. If your goal is to move fiat to crypto and interact with DeFi, prefer venues that support efficient routes into ETH and major Layer‑2s. Market cap helps explain why ETH pairs tend to be more liquid than mid/small alternatives, but execution quality still depends on the specific exchange and the network fee environment at the time you trade.
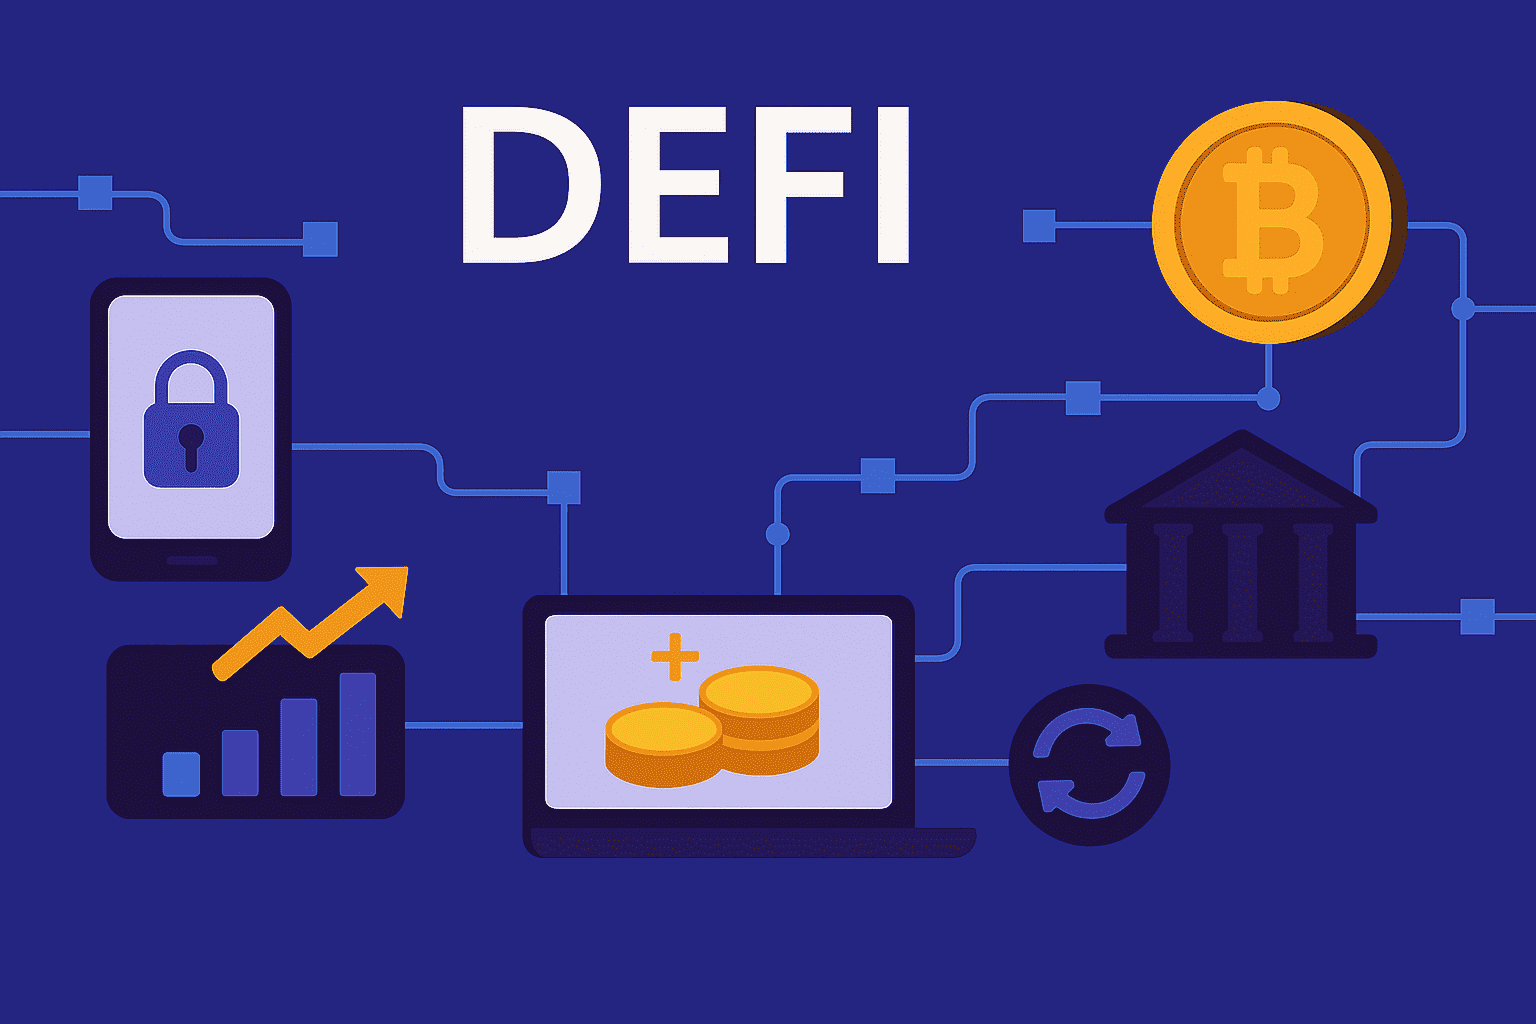
5.3 DeFi tokens
DeFi assets often debut with a small float and a large FDV. The sustainability of their market cap depends on whether the protocol generates real usage: TVL growth, fee revenue, sticky liquidity, and healthy incentive design. Combine market cap with unlock calendars and protocol metrics to avoid “valuation traps” where supply expands faster than demand.
5.4 Stablecoins
Stablecoin market caps reflect adoption and trust in peg mechanisms. A high market cap signals broad usage, but stability hinges on reserves quality, redemption mechanics, and multi‑chain bridge safety. For payments and transfers between exchanges, USDT and other stablecoins can minimize volatility and total costs, especially when you select routes with low network fees.
5.5 Meme coins
Meme coins can experience explosive jumps in market cap during narrative spikes, only to mean‑revert when attention fades. Because the float is often small and concentrated, order books can be thin. Treat market cap for such assets as a snapshot of enthusiasm, not a guarantee of durability.
5.6 Layer‑2 networks
Layer‑2 tokens (optimistic rollups, ZK rollups) derive part of their value from scaling demand and fee economics tied to Ethereum. Here, market cap must be read alongside active addresses, bridge flows, sequencer revenue, and the cadence of decentralization milestones.
6. Regulation and macro drivers
Market cap is highly sensitive to policy and macro signals. ETF approvals, securities‑law guidance, tax changes, and exchange licensing can open or close demand channels overnight. Macro variables such as inflation, real yields, dollar liquidity, and risk appetite shape the willingness of institutions to hold crypto exposure. Your interpretation of market cap should include a view on these drivers.
| Driver | Potential impact on market cap | Investor response |
|---|---|---|
| ETF inflows/outflows | Shifts demand for underlying assets | Track flow data; align with trend strength |
| Rate hikes/cuts | Risk appetite expands or contracts | Adjust leverage and bucket weights |
| Regulatory restrictions | Liquidity migrates; delistings possible | Diversify venues; monitor jurisdictional risk |
| Tax policy | Behavior changes around realizations | Plan around deadlines; consider holding periods |
7. Choosing an exchange with market cap in mind
Large‑cap assets usually offer the best execution conditions, but venue differences still matter. When comparing the best crypto exchanges or your shortlist of top exchange platforms in a listing, check:
- maker/taker fee tiers and volume‑based discounts,
- supported networks for deposits and withdrawals (and their fees),
- order book depth at 1–2–5% from mid price on your target pairs,
- average spreads during peak hours,
- KYC/AML procedures and support responsiveness,
- policies for listing, risk management, and incident handling.
For retail flows, fiat to crypto exchange routes that end in stablecoins can be cheaper and faster than direct bank withdrawals. Reliable exchangers with USDT pairs and low commission exchange settings often deliver better all‑in pricing.
8. Portfolio construction by market cap
A practical approach is to bucket assets by size and assign target weights. One common template is 60% large‑cap for stability, 30% mid‑cap for growth, and 10% small‑cap for optionality. Rebalance periodically to avoid concentration risk and to harvest gains from segments that have outperformed.
| Bucket | Target weight | Method | Notes |
|---|---|---|---|
| Large‑cap | 50–70% | DCA; long‑term holds | Focus on deep liquidity and low fees |
| Mid‑cap | 20–40% | Swing trades | Monitor listings, narratives, unlocks |
| Small‑cap | 5–15% | Tightly risk‑managed bets | Prefer transparent venues and contracts |
9. Pre‑trade checklist
- Compare market cap with FDV; read the unlock schedule.
- Assess float, volumes, and order book depth on your venue.
- Check network health: transactions, active addresses, validator incentives.
- Understand tokenomics: issuance, burns, distribution, utility.
- Review regulatory status and delisting risk in your jurisdiction.
- Calculate total route cost: trading fees, network fees, spreads, FX.
10. Extended FAQ
1) Can I rely on market cap alone?
No. Treat it as a first‑pass filter. Combine it with liquidity metrics, unlock calendars, tokenomics, and venue conditions.
2) How is market cap different from price?
Price refers to one unit; market cap represents aggregate valuation. A $0.10 token can have a higher market cap than a $10 token if supply is much larger.
3) When should I focus on FDV?
When the project is young, float is small, and large unlocks are scheduled within your holding horizon.
4) Why does free float matter so much?
It better reflects coins that can actually hit the book. Low float plus hype often equals sharp volatility.
5) Does a large market cap guarantee stability?
No. It usually reduces relative volatility but does not eliminate event risk, hacks, or regulatory shocks.
6) How should I interpret the market cap/TVL ratio?
As a rough relative valuation tool for DeFi protocols. Extreme ratios can signal overheating or underutilization.
7) Why do ETFs matter for market cap?
They create new demand channels and can influence flows, especially for large‑caps like Bitcoin.
8) What role do derivatives play?
They amplify moves via liquidations. Market cap does not capture leverage; watch funding rates and open interest.
9) How do I find where to buy Bitcoin efficiently?
Compare not only the quote price but also fees, network costs, and execution quality across multiple reliable exchangers.
10) Are rankings by market cap ever misleading?
Yes, especially for tokens with concentrated ownership, small float, or manipulated volumes.
11) What is realized cap useful for?
It approximates the aggregate cost basis of holders and can inform cycle analysis.
12) How should I think about small‑caps?
They can deliver outsized returns but demand strict risk limits, position sizing, and venue diligence.
13) Does market cap affect exchange fees?
Indirectly. High‑cap assets often have tighter spreads and better liquidity, which reduces total cost even if headline fees are similar.
14) Should I compare sectors by market cap?
Yes, but adjust for business models. L1, L2, payments, DeFi, and gaming tokens monetize differently.
15) What about ownership concentration?
High concentration increases dump risk. Review token distribution and vesting schedules.
16) Do halvings affect market cap?
They can by altering issuance and narrative, but outcomes depend on demand and macro conditions.
17) Is market cap relevant for stablecoins?
It signals adoption, but resilience depends on reserves and redemption mechanics.
18) How do I choose between venues?
Use a checklist: fees, networks, depth, spreads, KYC/AML, support, incident history, and listing policies.
19) What is total route cost and why does it matter?
It is the sum of trading fees, network fees, spreads, and FX. It determines your real entry price more than the quote alone.
20) Can a small‑cap become a large‑cap quickly?
Yes during narrative spikes, but sustainability depends on real usage and distribution health.
21) How should I rebalance a market‑cap‑bucketed portfolio?
On a calendar schedule or when bucket weights deviate beyond set bands; aim to harvest gains and control risk.
22) Does market cap predict future returns?
Not directly. It correlates with liquidity and risk profile but does not forecast innovation or execution quality.
23) How do taxes interact with market cap changes?
They do not; taxes apply to realized gains/losses. But tax deadlines can influence flow around rebalances.
24) What red flags should I watch for?
Huge FDV gaps, opaque unlocks, extreme ownership concentration, fake volumes, and venues with poor incident response.
11. Conclusion
Market capitalization is an essential but incomplete lens. It quickly communicates scale, suggests typical liquidity, and helps structure portfolios. To make it decision‑grade, pair it with FDV, free float, realized cap, TVL, network health, and the concrete execution conditions on your chosen venue. If your goal is to compare the best crypto exchanges, shortlist top exchange platforms, or decide where to buy Bitcoin with minimal friction, evaluate total route cost, reliability, and regulatory posture alongside market cap. Do this consistently, and market cap becomes a reliable compass rather than a misleading headline number.