A price chart is the market’s diary written in price and volume. Learning how to read cryptocurrency charts helps you spot trends, recognize reversals, and separate random spikes from meaningful moves. This guide explains the main chart types, core patterns, indicators, and timeframes, and shows how to turn chart insights into better execution. It is equally useful when you compare top crypto exchanges, pick the best crypto exchange for your strategy and payment methods, decide where to buy Bitcoin, plan a fiat to crypto exchange, or search for reliable crypto exchangers with predictable costs.
Who is this for: newcomers taking their first steps in technical analysis, active traders who want a tidy ruleset, and businesses that accept crypto payments and monitor markets before conversions.
What a Chart Is Made Of
A price chart is a sequence of quotes over time. Most platforms let you switch among line, candlestick (Japanese Candlesticks), bar (OHLC), and price‑movement based views like Renko or Heikin Ashi. Each format highlights different details.
Common Chart Types
- Line: only the close for each period. Great for the big picture and long timeframes.
- Candlestick: shows open, high, low, close (OHLC). The most popular format on crypto markets.
- Bar (OHLC): an alternative to candles; precise for intraday detail.
- Heikin Ashi: smooths noise and emphasizes trend, but distorts raw open/close.
- Renko/Range: focuses on price movement and filters out time; useful for support/resistance mapping.
Timeframes: Choosing Your Lens
A timeframe is the duration represented by a single candle/bar (1m, 5m, 1h, 4h, 1D, 1W, 1M). Pick it according to your strategy and the asset’s volatility. Higher timeframes reduce noise and reveal the primary trend; lower timeframes deliver fast signals and require strict risk control.
- Investors and position traders: 1D/1W/1M.
- Swing trading: 4H/1D.
- Day trading: 5–15m/1H with 4H confirmation.
Trends, Ranges, and Volatility
Markets are either trending (uptrend/downtrend) or ranging (sideways). An uptrend is a sequence of higher highs and higher lows; a downtrend is the opposite. A range anchors between support and resistance. Volatility measures amplitude and informs position size.
- Support: an area where demand historically absorbs supply.
- Resistance: an area where supply overcomes demand.
- Trendlines: helper lines drawn across swing highs/lows; they work best with volume context.
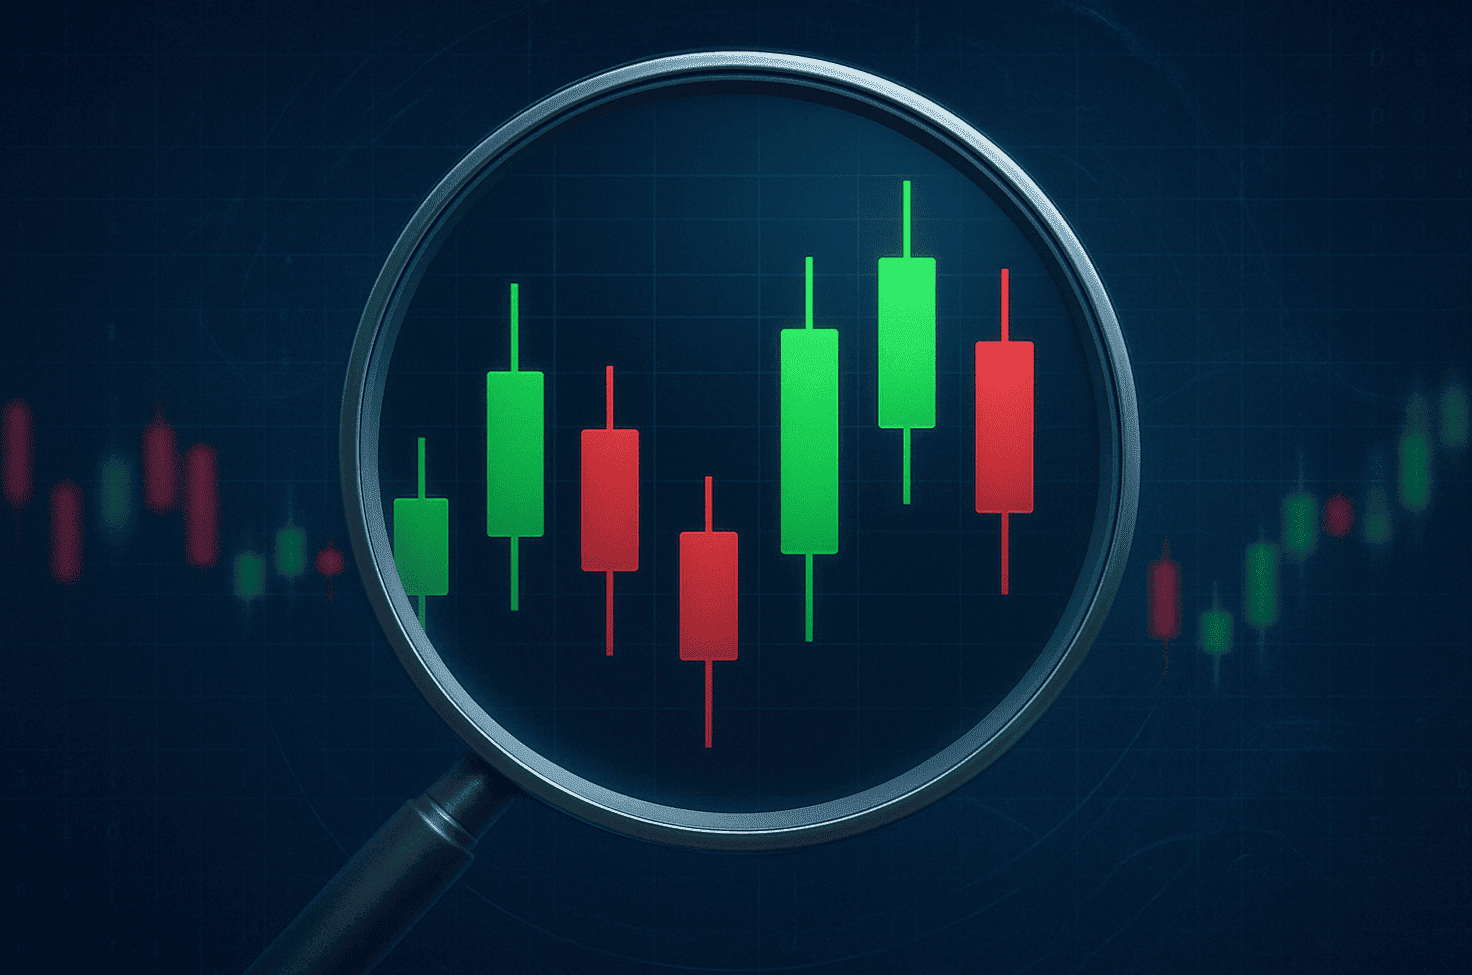
Candlestick Patterns and What They Signal
Candle formations help read the tug‑of‑war between buyers and sellers. Always judge patterns in the context of trend and levels, not in isolation.
- Engulfing (bullish/bearish): highlights a shift in momentum.
- Pin bar/Hammer/Hanging Man: long wick shows rejection at a level.
- Doji: indecision; look for confirmation.
- Three Soldiers/Three Crows: a series of similar candles indicating trend strength.
Indicators: Trend Tools and Oscillators
Indicators condense raw data into signals. Stick to one or two trend indicators and one oscillator to avoid contradiction overload.
- Moving Averages (SMA/EMA): trend direction and dynamic support/resistance; crossovers as areas of interest.
- MACD: a difference of EMAs with a histogram; great for momentum shifts.
- RSI: overbought/oversold plus price divergences.
- Bollinger Bands: volatility bands and extremes; squeezes often precede expansion.
- ATR: a volatility yardstick for stop‑loss sizing.
- OBV/Volume Profile: links price and volume to reveal “fair” areas.
Volume: Fuel for the Move
Volume confirms breakouts and reversals. A breakout with strong volume is more likely to persist. When price breaks a level without volume support, the odds of a trap increase. Watch for abnormal volume bars near key levels.
Fibonacci, Channels, and Chart Patterns
Fibonacci retracements (38.2%, 50%, 61.8%) mark likely pullback zones within a trend. Channels define a corridor for price. Patterns such as flags, pennants, triangles, double tops/bottoms, and head‑and‑shoulders frame scenarios with clean invalidation points.
From Chart to Trade Plan
- Define the backdrop: higher‑timeframe trend, key levels, upcoming news.
- Draft scenarios: base case, alternate case, and invalidation.
- Specify your trigger: candle, crossover, breakout on volume, or return inside range.
- Set risk: position size, stop loss, targets, and a time‑based invalidation.
- Run a test trade and journal the result.
Common Pitfalls When Reading Charts
- Hunting for a “perfect” indicator instead of following a ruleset.
- Ignoring volume and level context.
- Overfitting: too many lines and parameters that only explain the past.
- Trading inside noise on very low timeframes.
- Lack of exit planning and poor risk management.
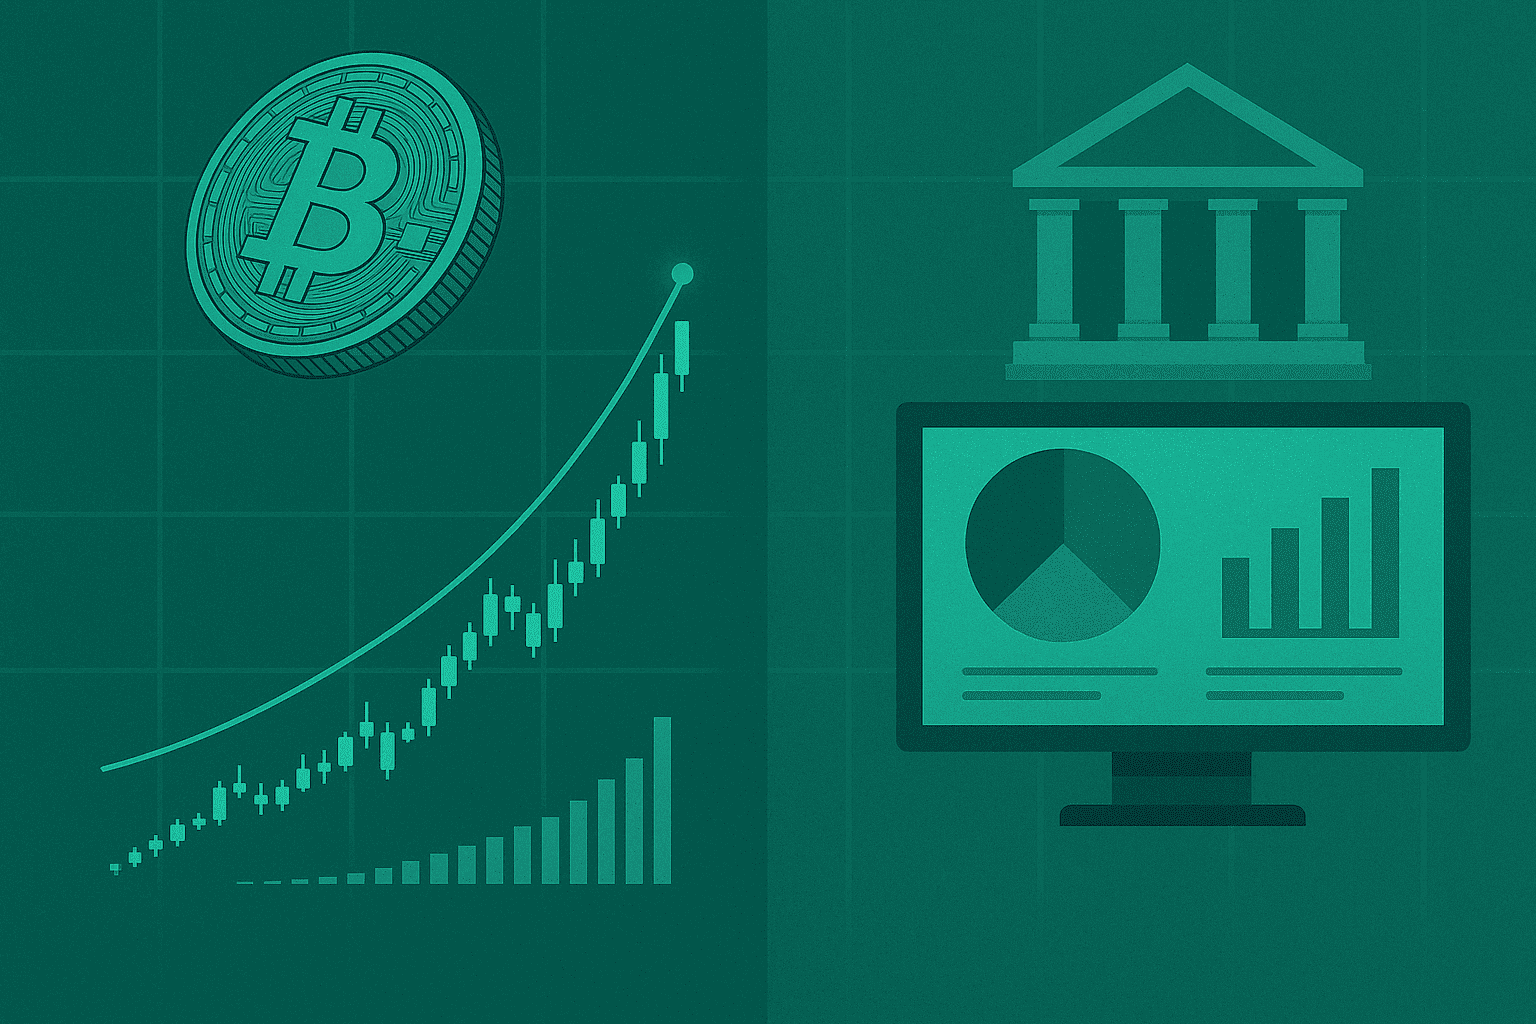
How Charts Help You Choose an Exchange or Service
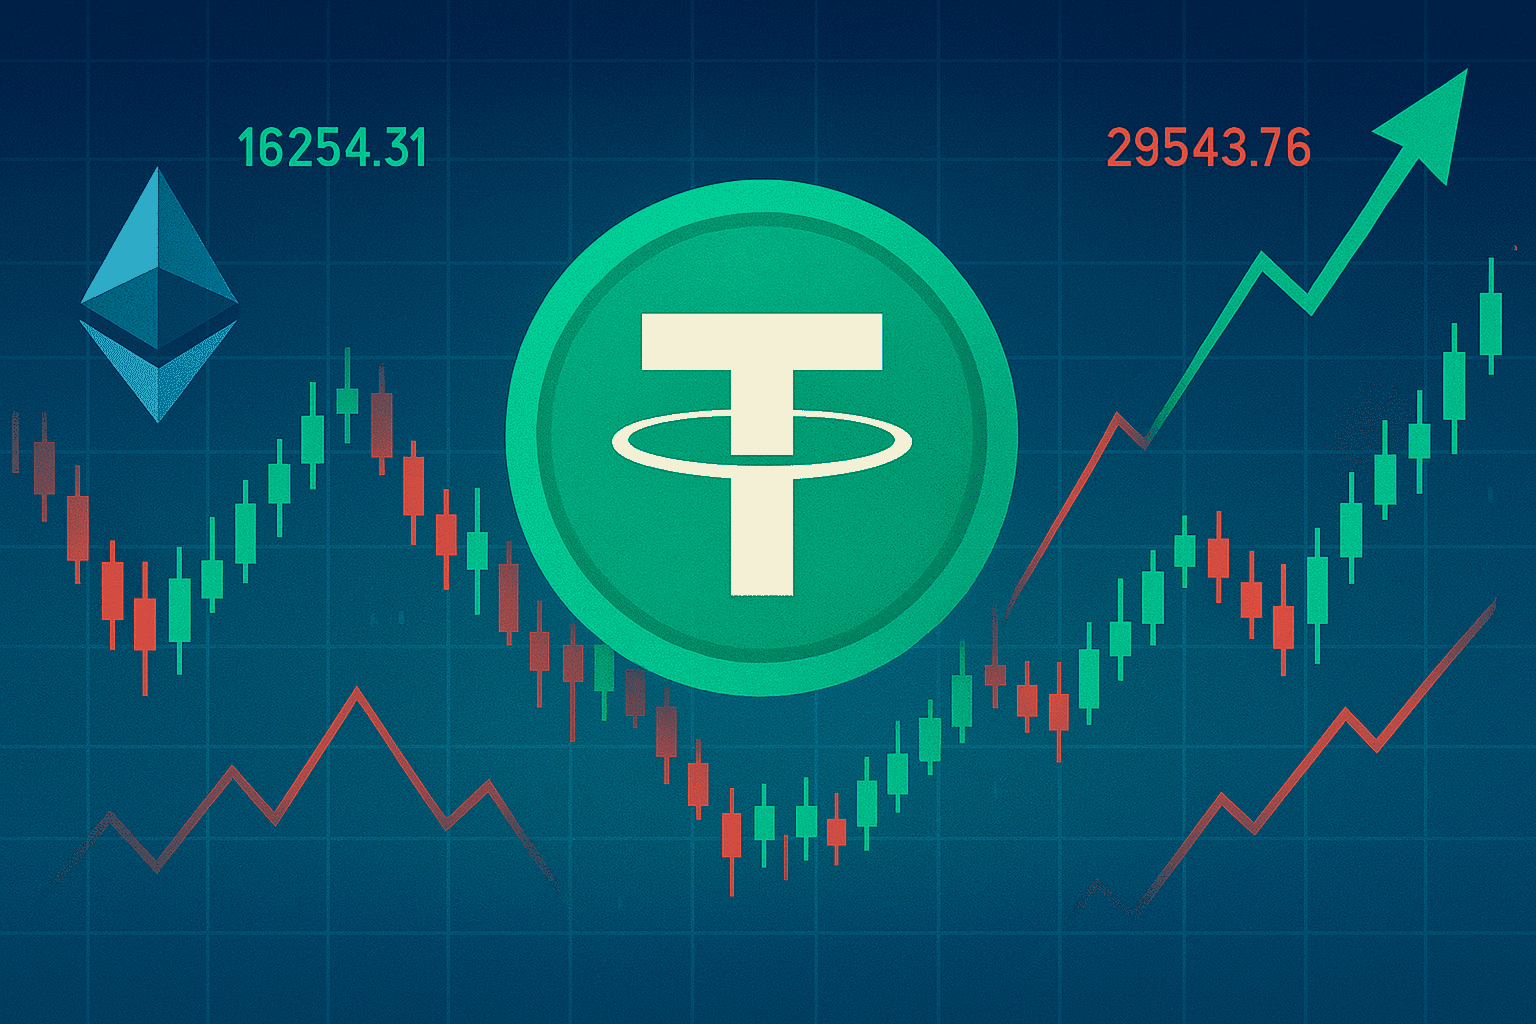
Technical analysis is more than entries and exits; it also informs your operational needs. If you trade short impulses you need speed and liquidity. If you hold for days or weeks you need low net costs, a wide choice of pairs, and reliable support. These insights influence how you compare top crypto exchanges and reliable crypto exchangers, where to buy Bitcoin without wasteful costs, and which USDT exchangers fit stable‑pair strategies. For large tickets, prefer the best crypto exchange candidates with deep order books; for small and time‑sensitive swaps, an instant route can be practical.
Platform Formats and When to Use Them
| Format | When to choose it | Pros | Limitations |
|---|---|---|---|
| Centralized Exchanges (CEX) | Need limit/market orders, API, and deep markets | Liquidity, tools, strong USDT markets | KYC/AML, custodial risk, deposit/withdrawal fees |
| P2P Platforms | Prefer local payment rails and flexibility | Varied methods, often competitive local pricing | Counterparty checks, dispute risk, manual steps |
| Instant Non‑custodial Exchangers | Quick swaps without an account | Simplicity, speed, occasional promos with low exchange fee | Wider spreads, transaction limits |
Example: Linking a Signal to Execution
- Signal: price breaks out of a triangle on elevated volume.
- Action: place a limit order on the retest with partial fills.
- Venue: shortlist the best crypto exchange options with deep books, tight spreads, and fast funding/withdrawals.
- Cost check: trading fee + spread + network fee; chase the truly low exchange fee path.
- Using fiat: choose a fiat to crypto exchange with clear rates and local bank support.
Table: Tools for Reading Charts and What They Offer
| Tool/Platform | Key capabilities | Best use case |
|---|---|---|
| Exchange web terminals | Candles, volume, indicators, order book depth | Fast decisions, direct order integration |
| Specialized charting suites | Rich indicators, alerts, screeners, multi‑charts | Deep analysis, multiple markets at once |
| On‑chain dashboards | Exchange flows, active addresses, network health | Combine technical analysis with on‑chain signals |
Risk Management: Sizing for Volatility
- Use ATR or standard deviation to set stop‑loss distance.
- Align position size with the asset’s volatility and liquidity.
- For large tickets, scale in/out and split orders.
- Keep a trading journal: chart screenshots, entry/exit reasons, and outcomes.
FAQ
Which chart type should beginners use?
Candlesticks are a great starting point. They show open, high, low, and close, making it easier to read patterns and combine with volume.
What timeframe is best?
There is no magic timeframe. Combine a higher timeframe for context (1D/1W), a working timeframe for signals (4H/1H), and a lower one for precise entries.
How many indicators do I need?
Two or three are enough: one trend tool (EMA/SMA), one oscillator (RSI/MACD), and optionally a volatility gauge (ATR or Bollinger Bands).
Can I trade patterns alone?
Patterns work best with levels, volume, and risk rules. Taken alone, they do not guarantee an edge.
How do I choose an exchange that fits my strategy?
Check liquidity, spreads, funding/withdrawal methods, and stable‑pair support. A curated listing helps you compare top crypto exchanges, filter for reliable crypto exchangers and USDT exchangers, and follow a clear process for how to choose an exchange.
Quick Pre‑Trade Checklist
- Context: trend, levels, news, and volatility.
- Trigger: the concrete signal for entry/exit.
- Plan: stop‑loss, targets, and what invalidates the setup.
- Execution: match the best crypto exchange to your pair and payment rail; estimate total cost.
- Post‑trade: review assumptions and improve rules.
Beginner Path: From the First Chart to the First Purchase
- Open a daily BTC/USDT chart and draw support/resistance across recent swing points.
- Add EMA 50/200 and RSI 14. Mark crossovers and overbought/oversold zones.
- Check volume on breakouts: look for confirmation.
- Build a scenario and timeline. If you need fiat on‑ramps, use a fiat to crypto exchange with transparent pricing.
- Make a small test buy. If you’re deciding where to buy Bitcoin, compare fees and spreads in a listing with filters for reliable crypto exchangers, low exchange fee, and USDT exchangers.
Deep Dive: Step‑by‑Step Reading Examples
Scenario 1: Support Break without Volume and a Return into Range
Price dips below local support but volume stays near the 20‑period average. Rather than chasing, wait for a re‑entry into the range and a candle confirmation. Then look for a tight‑risk entry with a stop just beyond the failed break.
Scenario 2: Trend Continuation after a Bollinger Squeeze
A low‑volatility phase ends with an impulse in the direction of the prior trend. Add filters: EMA 50 above EMA 200 and RSI above 50. Enter on a retest and size the stop using ATR.
Scenario 3: RSI Divergence with Rising Volume
A new price high comes with a lower RSI, but volume does not fall — that can imply only a shallow pullback. Watch price behavior around the prior high for confirmation.
Reading Volume in Detail: CVD and Profiles
Cumulative Delta (CVD) sums the difference between aggressive buys and sells. If price rises while CVD flattens, the move may be tiring. Volume Profile highlights high‑activity areas that often act as magnets.
- POC (Point of Control): the highest‑volume price; often a gravity level.
- HVN/LVN: high/low volume nodes; HVNs slow price, LVNs accelerate it.
Glossary for Fast Navigation
- OHLC: open, high, low, close values of a candle.
- Retest: a return to a broken level to check it as support/resistance.
- Liquidity sweep: stop runs beyond a level followed by a sharp return.
- Breakout/Breakdown: exiting a range upward/downward.
- Invalidation: a condition after which the idea is considered wrong.
Data to Track Beyond Price
- News and network updates: hard forks, listings, product launches.
- On‑chain signals: exchange wallet balances, active addresses.
- Macro context: dollar liquidity, rates, and risk sentiment.
Connecting Technicals to Your Exchange Choice
If your strategy is scalping on low timeframes, look for speed, tight spreads, and responsive funding routes. For swing trades, prioritize stable fees and consistent withdrawals. Use a listing to compare top crypto exchanges by these metrics, find the best crypto exchange in your region, evaluate where to buy Bitcoin with your payment method, and filter for reliable crypto exchangers. For stable pairs specifically, short‑list USDT exchangers.
Comparison Table: What Matters When Picking a Venue
| Criterion | Why it matters for chart users | What to check |
|---|---|---|
| Liquidity | Improves spreads and execution quality | Order‑book depth, 24h volume |
| Fees | Directly impacts PnL | Maker/taker, network fees, genuinely low exchange fee |
| Payment methods | Funding speed to act on signals | Cards, SEPA/SWIFT, local bank rails |
| Reliability | Operational risk and uptime | Reviews, incident history, SLA |
Workspace Tips
- Keep separate layouts: high timeframe, working timeframe, and execution view.
- Avoid indicator overload; two or three quality signals beat a noisy dashboard.
- Label levels and patterns, and save pre‑ and post‑trade screenshots for review.
Safety and Compliance When Using Exchanges
Even the best crypto exchange cannot fully eliminate operational hiccups or bank delays. Keep backup deposit/withdrawal routes, avoid parking all capital in one venue, and verify transaction limits. If you need on‑ramps, choose a fiat to crypto exchange that supports your bank and shows clear fees.
Quick P2P Playbook
- Filter counterparties by rating and completed volume.
- Agree on details in the platform’s chat; do not move to private messengers.
- Use escrow and confirm release only after funds settle.
- Start with a small test transfer before scaling up.
Case Studies: Reading Context and Avoiding Traps
Case A: A Thin Overnight Breakout
During low‑liquidity hours price pierces a prior high, but spreads are wide and volume is muted. Instead of chasing, wait for a regular‑session retest and see whether volume confirms. Failing that, treat it as a liquidity sweep.
Case B: Pre‑news Coil under Resistance
Price compresses beneath a strong level, Bollinger Bands narrow, and volume dries up. Stops often cluster above the level, leading to a sweep and snap‑back. Only act with confirmation and a predefined invalidation.
Case C: Ascending Channel with Aggressive Bids
Repeated touch‑backs to the lower channel line come with abnormal buy volume. This favors buying the dips with stops below local lows and partial profit‑taking near the top of the channel.
Pre‑Trade Workspace and Process
- Prepare templates for analysis, execution, and review.
- Keep alert rules consistent with your strategy and time availability.
- Automate journaling fields (setup type, risk, outcome) to reduce bias.
Conclusion
Chart reading is a skill built through practice. Combine market structure, patterns, indicators, and volume with strict risk rules and thoughtful execution. Once you know what the chart says and which timeframe fits your style, it becomes easier to pick tools, align with a suitable venue, and act decisively. Use curated listings to compare top crypto exchanges, find the best crypto exchange for your needs, decide where to buy Bitcoin without friction, and select reliable crypto exchangers with transparent terms. For stable pairs, consider USDT exchangers and pay attention to total cost so that your route remains a true low exchange fee path.