Technical indicators transform raw price and volume into readable signals. On the always‑on crypto market, they help you identify trend direction, momentum shifts, volatility regimes, and trader participation fast enough to matter. This guide breaks down the main technical analysis indicators, shows how to combine them into a compact rule set, and explains how to turn signals into execution choices. You will also see how indicator‑driven workflows intersect with practical questions: comparing top crypto exchanges, choosing the best crypto exchange for your needs, deciding where to buy Bitcoin, planning a fiat to crypto exchange, or filtering reliable crypto exchangers, including USDT exchangers with a genuinely low exchange fee.
Minimal toolkit, maximum clarity: one trend filter, one oscillator, one volatility tool — plus volume. Fewer tools mean clearer rules.
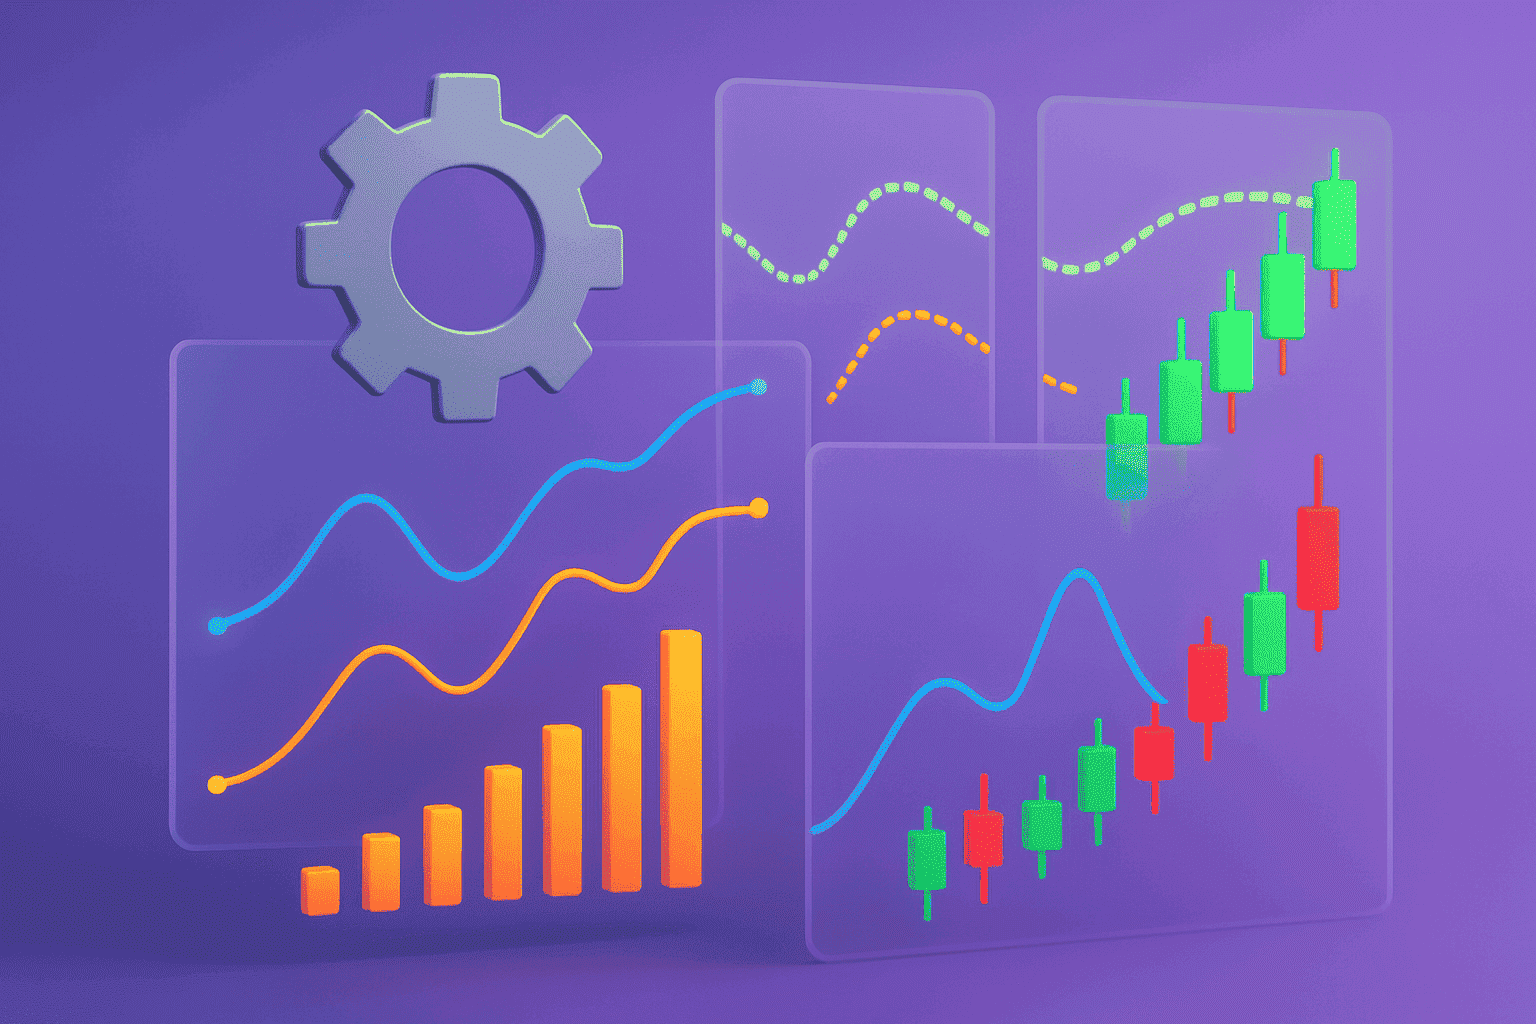
Indicator families
- Trend: SMA/EMA, MACD (as trend/momentum filter), Ichimoku, ADX, Supertrend.
- Oscillators: RSI, Stochastic, CCI, Williams %R.
- Volatility: ATR, Bollinger Bands, Keltner Channels.
- Volume/flow: OBV, Money Flow Index (MFI), Volume Profile/CVD.
- Complex/structural: Ichimoku, market structure (HH/HL/LH/LL), ZigZag, Pivot levels.
Trend indicators
SMA & EMA — the backbone
Moving averages smooth noise and reveal the dominant direction. SMA weights history evenly; EMA emphasizes recent prices and reacts faster. Popular pairs: 50/200 for mid‑term bias, 20/50 for swing trading, 9/20 for active systems. Typical signals: slope, crossovers (golden/death cross), and retests of the average as dynamic support/resistance.
MACD — momentum and phase change
MACD is the difference between two EMAs with a signal line and histogram. It highlights fading momentum and works well as a higher‑timeframe filter: take setups only in the trend direction; down‑weight counter‑signals unless confirmed. Watch for price‑histogram divergences near levels.
Ichimoku Kinko Hyo — all‑in‑one context
Ichimoku blends trend (Kumo cloud), momentum (Tenkan/Kijun), a lagging filter (Chikou), levels and breakouts. A baseline signal is a close above/below the cloud, supported by Tenkan/Kijun angles and a favorable Chikou position. Upside: rich single‑pane context. Downside: a learning curve and parameter complexity.
ADX — strength of the move
Average Directional Index measures trend strength regardless of direction. Values around 25–30+ favor trend‑following; low readings favor range tactics. Use ADX to avoid fighting powerful moves.
Supertrend — trailing made simple
Supertrend builds a dynamic trailing line (often ATR‑based). It’s excellent for managing positions within a trend but tends to flip repeatedly in chop; pair it with a range filter such as ADX or Bollinger.
Oscillators
RSI — impulse balance
Relative Strength Index compares advancing versus declining moves. Classic bounds are 30/70. In trends, ranges shift (bull 40–80, bear 20–60). Draw trendlines on RSI itself and hunt for divergences at levels to time entries/exits.
Stochastic — position within a range
Stochastic shows where price closes within a lookback range. It helps time trades in consolidations and on lower timeframes but needs trend/level confirmation to avoid counter‑trend traps.
CCI & Williams %R — extremes and skews
These tools react to quick deviations from typical behavior. They shine in ranges; against strong trends their signals are often early — always add context.
Volatility and risk
ATR — the measuring stick
Average True Range approximates the typical swing size. Use ATR for stop placement, trailing and position sizing: position size = risk in currency / (k × ATR), where k is a strategy multiple.
Bollinger Bands — squeezes and expansions
A moving average ± k standard deviations. A squeeze often precedes large moves. A simple touch of the outer band is not a signal; focus on candle closes relative to the band and the behavior of volume/flow.
Keltner Channels — ATR envelopes
Keltner envelopes are less sensitive to outliers than Bollinger and track trend moves well. Many traders combine both: a narrow Keltner inside a wider Bollinger hints at a regime ready to expand.
Volume & flow indicators
OBV — participation confirmation
On‑Balance Volume accumulates volume in the direction of closes. It validates breakouts and exposes early divergences: if price rises while OBV stalls, momentum may be fading.
MFI — money flow
Money Flow Index blends price and volume to reflect capital rotation across assets. It is useful on altcoins; watch for 20/80 zones and divergences.
Volume Profile & CVD
Volume Profile highlights zones with the most traded interest (POC, HVN, LVN). Cumulative Volume Delta sums the imbalance of aggressive buys/sells. Together they show where the market “did business” and who currently dominates.
Table 1. Key indicators at a glance
| Indicator | What it measures | Strengths | Limitations |
|---|---|---|---|
| SMA/EMA | Direction and dynamic levels | Simple, universal | Lags at turns |
| MACD | Trend momentum | Divergences, filter | Whipsaws in ranges |
| RSI | Impulse balance | Great in ranges | Early counter‑signals in trends |
| Stochastic | Location in range | Precise timing on LTF | Noisy without filters |
| Bollinger Bands | Volatility around a mean | Squeeze/expansion cues | No direction by itself |
| ATR | Typical swing size | Stops and sizing | No direction info |
| OBV | Volume balance | Confirms breakouts | Weaker on thin pairs |
| Ichimoku | Trend + momentum + levels | One‑pane context | Parameter complexity |
Combining indicators
- Trend + timing + volatility: EMA 50/200 + RSI + ATR.
- Trend + squeeze logic: Keltner + Bollinger; enter on breakout‑retest.
- Trend + volume: EMA + OBV/MFI for participation confirmation.
- Structure + indicator: support/resistance + MACD/RSI to avoid mid‑range trades.
Common mistakes
- Trading a single indicator without level, trend and volume context.
- Stacking tools that repeat the same information.
- Chasing every tick on minute charts without higher‑timeframe alignment.
- Ignoring execution costs: spread, trading fees and network charges.
- No invalidation rule — nothing that clearly says “the idea is wrong”.
Practical setups
Setup 1: EMA 50/200 + RSI + ATR
Context: EMA 50 above EMA 200 with positive slope. Trigger: pullback to EMA 50 and bounce; RSI above 50. Risk: stop = 1–1.5 × ATR below the local swing; size = monetary risk / stop. Execution: prefer venues with tight spreads and predictable fees; if you need fiat rails, plan a fiat to crypto exchange with transparent rates.
Setup 2: Bollinger squeeze + MACD
Bands compress and MACD crosses in the higher‑timeframe direction. Enter on a retest of the middle band. Confirmation: rising volume and a sequence of closes in the intended direction.
Setup 3: RSI divergence + OBV
Price makes a higher high while RSI prints a lower high, but OBV does not drop. Expect a shallow correction and continuation. In ranges, apply symmetrically at lows.
Table 2. Pick indicators by market condition
| Scenario | Use | Avoid | Note |
|---|---|---|---|
| Strong trend | EMA/SMA, MACD, Keltner | Early RSI counter‑calls | Go with the flow; scale out |
| Range/consolidation | RSI, Stochastic, Bollinger | Very long MAs | Trade the edges with clear invalidation |
| High volatility | ATR, Bollinger, Volume Profile | Slow oscillators | Reduce size, widen stops |
| Thin liquidity | OBV/MFI, higher TFs | Fast 1–5m entries | Beware wicks and liquidity sweeps |
Extended set and parameters
Donchian Channels
Mark the highest/lowest price over N periods. A breakout with volume confirmation is a classic trend signal. Combine with an ATR stop and a retest rule.
Parabolic SAR and trailing
Provides simple dots for trend trailing. Easy to execute, but prone to frequent flips in chop — filter with ADX or range context.
Parameter cheat‑sheet
| Indicator | Typical settings | When to adjust | Risk of misuse |
|---|---|---|---|
| EMA | 9/20/50/200 | Shorter for fast markets; longer for investing | Lag or too many crossovers |
| RSI | 14; bounds 30/70 | Ranges: 20/80; fast trading: 7–9 | Counter‑trend bias |
| MACD | 12/26/9 | Shorter EMAs on lower TFs | Noise and whipsaws in chop |
| Bollinger | 20 SMA; k = 2 | Calm assets: k ≈ 2.5 | Ignoring levels and volume |
| ATR | 14 periods | Faster markets: 10; slower: 20 | Too wide or too tight stops |
| ADX | 14 periods | Trend systems: 10; range trading: 20 | Late at reversals |
Quality filters for signals
- Level: signal forms at/near support or resistance, not in “empty space”.
- Volume/flow: confirmation via OBV/MFI shift or a spike vs 20‑period average.
- Higher timeframe: align with at least one or two TFs above.
- Candle confirmation: a close through the level or a clear rejection pattern.
- Execution cost: expected edge must exceed fee, spread and network cost.
How indicators inform venue selection
Frequent short trades thrive on tight spreads and fast funding; position trading needs predictable fees, deep books and steady withdrawals. Use curated listings to compare top crypto exchanges, choose the best crypto exchange for your payment rail, decide where to buy Bitcoin efficiently, and shortlist reliable crypto exchangers. For stable pairs, include USDT exchangers and always compute the full route cost to ensure a truly low exchange fee.
Build your own indicator system
- Define your goal: scalping, day trading, swing, or investing — this sets TFs and sensitivity.
- Pick a trend filter: EMA 50/200 or Ichimoku. Write what qualifies as uptrend/downtrend.
- Add a timing oscillator: RSI or Stochastic with explicit zone/trigger rules.
- Add volatility: ATR for stops/sizing; optionally Bollinger/Keltner for squeeze logic.
- Write invalidation: the level/condition that cancels the idea.
- Define management: partial exits, trailing method, breakeven rule.
- Backtest, then forward‑validate live with small risk.
- Journal: before/after screenshots, reasoning, outcomes and lessons.
Pre‑trade checklist
- Higher‑TF context (trend, levels, news) marked?
- Signal forms at a level rather than mid‑range?
- Volume/second factor confirms?
- Stop sized via ATR and position sizing computed?
- Execution route (pair, venue, spread, fees, network) mapped?
Case studies
Case A. Continuation after a squeeze
On 4H, Bollinger Bands compress while ADX rises from 18 to 26 and EMA 50 sits above EMA 200. Price pokes the upper band and closes beyond it on expanding volume. Plan: wait for a retest of the middle band, place a stop 1.2 × ATR below the local swing, and target either the prior range height or the 14‑period ATR projection.
Case B. Reversal via multi‑signal divergence
On 1D, price makes a higher high; RSI makes a lower high; the MACD histogram fails to print a new peak; OBV plateaus. A strong rejection candle forms at resistance. Reduce exposure or flip with a tight stop above the high and partial targets at prior swing lows.
Case C. Donchian breakout with ATR management
A 20‑period Donchian Channel breaks on 1H with volume above the 20‑period average. Enter on the break or the retest, place the stop 1 × ATR inside the channel, and trail at 1.5 × ATR once the trend is established.
Risk management by the numbers
- Per‑trade risk: 0.5–2% of equity depending on volatility and win rate.
- Position size = risk (USD/USDT) / (k × ATR); k = 1.0–1.5 for swing, 0.7–1.0 for day trading.
- Trailing: EMA 20/50, 1–2 × ATR from extremes, or structure‑based trailing (last HL/LH).
- Partial exits: scale at prior swing points or band edges to reduce variance.
Process discipline
- Define invalidation before entry and respect it.
- Use alerts on levels and indicator combos to avoid screen fatigue.
- Weekly review: what worked, what failed, and why.
Deep FAQ
How many indicators do I really need?
Usually three: one trend, one oscillator, one volatility tool. Add more only if each adds unique, non‑overlapping information.
Best parameters for SMA/EMA?
Common sets: 20/50 for swing, 50/200 for mid‑term, 9/20 for active systems. Optimal values depend on asset and timeframe — test and review your journal.
Do indicators work on minute charts?
Yes, but noise and execution costs rise. Align with a higher timeframe and reduce size.
Bollinger or Keltner?
Bollinger emphasizes outliers; Keltner tracks trends smoothly. Together they help detect squeezes and likely expansions.
How do I judge reliability?
Look for confluence: level + trend + volume + time context. A lone indicator without context is a weak reason to trade.
Glossary
- ATR — Average True Range, a volatility measure.
- Divergence — mismatch between price and indicator suggesting momentum loss.
- Invalidation — the condition that makes the trade idea wrong.
- POC/HVN/LVN — point of control and high/low volume nodes in a Volume Profile.
Workspace tips
- Separate layouts for higher TF, working TF and execution.
- Minimize indicators, maximize clarity; two or three quality signals beat clutter.
- Keep templates for level markup and reusable pre‑trade checklists.
Conclusion
Indicators are tools for discipline, not magic. They work best alongside levels, volume, candle behavior and robust risk management. Pick a compact set that fits your style, codify the rules, test them on history and then validate live with small risk. Plan execution with liquidity and costs in mind — that’s how you use a listing to compare top crypto exchanges, select the best crypto exchange for your payment method, decide where to buy Bitcoin efficiently, and rely on reliable crypto exchangers. For stable pairs, include USDT exchangers and always compute the full route cost so a low exchange fee is not a promise but a reality.