What Determines the Value of Cryptocurrency? — Full Guide
The value of a cryptocurrency is more than a ticker number. It is a concentrated expression of supply and demand, community trust, network risk, the asset’s utility, and investor expectations about the future. Price changes every second because of market microstructure — order book depth, liquidity, market‑maker behavior, and headlines. “Value,” however, is broader: utility, network effects, token monetary policy, security, and institutional support. In this guide we unpack what determines the value of a cryptocurrency, how to read market signals, and how to prepare for volatility so you can make informed decisions.
We organize the drivers into several groups: fundamentals (utility, scarcity, issuance policy), market structure (liquidity, market cap, the role of stablecoins and derivatives), technology (scalability, security, upgrades), behavior (investor expectations, FOMO/FUD, narratives), regulation (government policy, taxes, banking rails), and macroeconomics (rates, inflation, USD liquidity). We also include tables, checklists, and an extensive FAQ with practical pointers.
What we mean by “value” of a cryptocurrency
Price vs. value
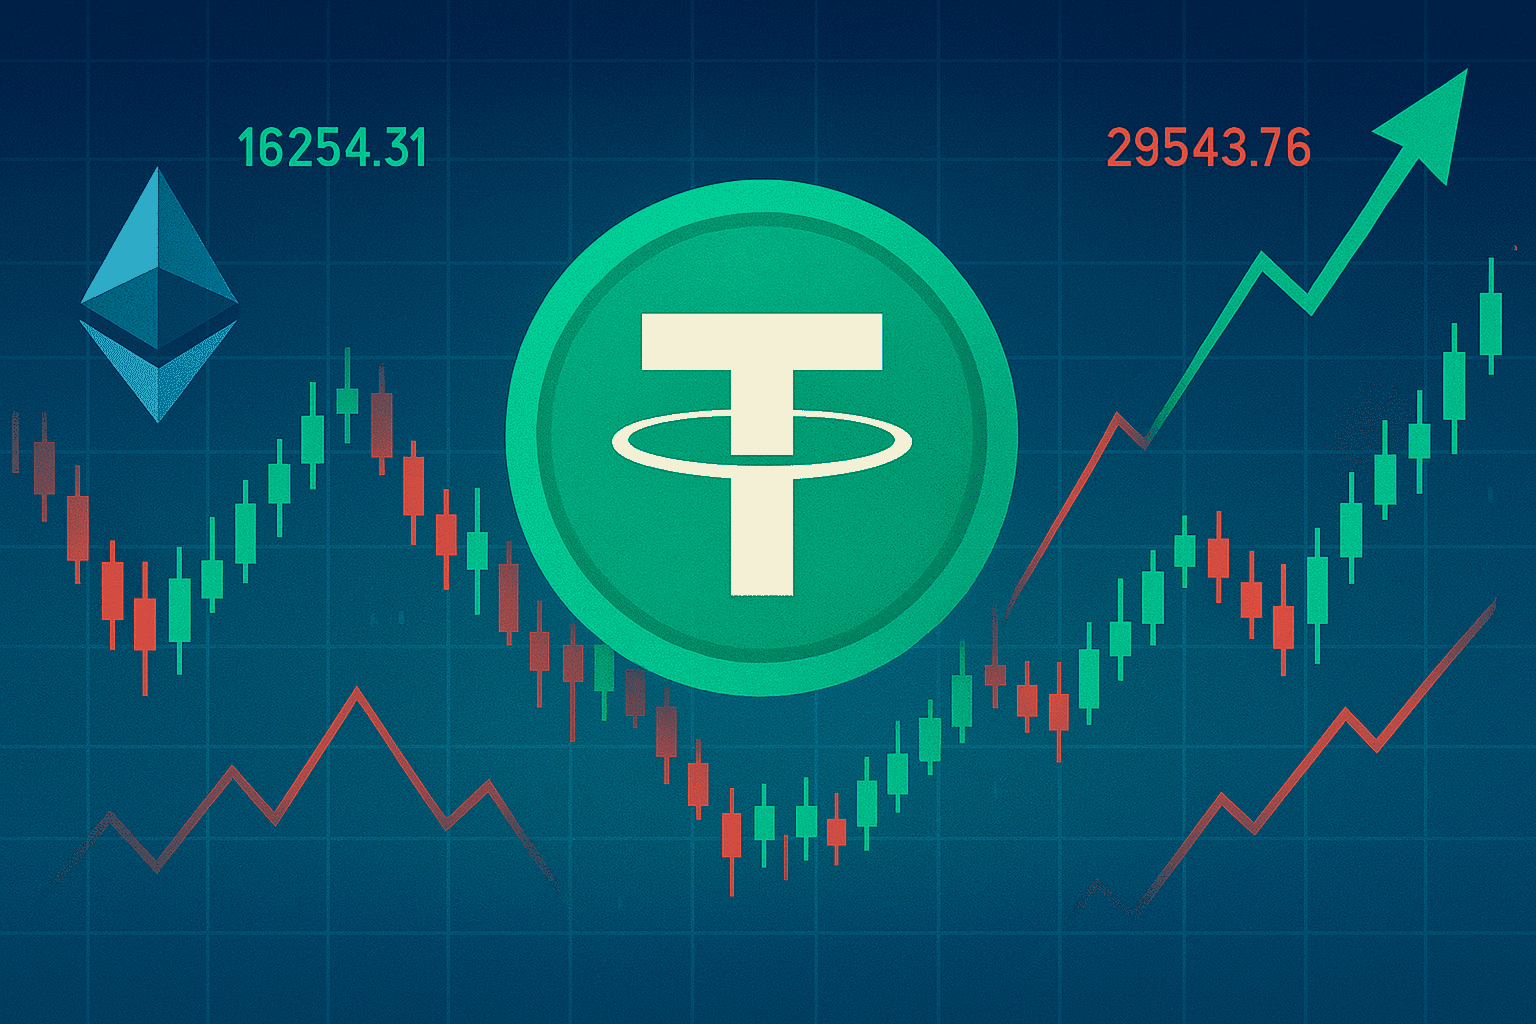
Price is the outcome of the latest trade on an exchange; it reflects the instant balance of orders. Value is expected utility over the asset’s lifetime: does it generate cash flow, reduce costs, grant access to network services, or act as “digital gold”? In the short run, price can deviate from fundamental value due to news, rumors, and liquidity imbalances, but over longer horizons the two tend to converge.
Where pricing comes from
- Spot markets on CEX/DEX: order books, AMM pools, and liquidity aggregators.
- Derivatives: futures, perpetuals, options — they shape expectations and hedging.
- OTC and market makers: define spreads and depth outside public books.
- Stablecoin rails and cross‑chain bridges: determine how easy it is to enter/exit the asset.
“Market cap” and “price” are not the same as utility: a thinly traded asset can jump in price without any real increase in value — simply because of a narrow book and shallow liquidity.
Supply: issuance, scarcity, and lockups
Unlike equities, tokens usually don’t pay dividends, but they do have a monetary policy: issuance schedule, supply cap, burn mechanisms, validation rewards, staking, and locks. Value is sensitive to expected scarcity and the circulating float.
- Issuance schedule: fixed (Bitcoin), programmed decay (halvings), or elastic via EIP‑1559‑like burns.
- Circulating vs. fully diluted supply: large team/treasury vestings can create sell pressure after unlocks.
- Staking/lockups: reduce liquid float and increase price sensitivity to demand shocks.
- Fee burns: in networks with burn mechanics, stress periods can make the asset temporarily deflationary.
Demand: utility, network effects, and narratives
Utility
The more real‑world use (payments, DeFi, gaming, data, infrastructure), the more stable the demand. Fees, staking, and service access give users reasons to hold the asset beyond speculation.
Network effects
Developers, active addresses, TVL, and integration with wallets/exchanges amplify demand non‑linearly: more participants, more value.
Narratives and brand
“Digital gold,” “world computer,” “fast and cheap payments,” “privacy by default” — narratives shape willingness to pay.
Durable demand exists where users have a reason to own the token today, not only because it might go up tomorrow.
Liquidity and market microstructure
Liquidity is the ability to buy/sell without moving the price much. High liquidity lowers volatility and execution cost. In practice, look at order‑book depth, number of exchanges/pairs, market‑maker activity, spreads and slippage, the presence of perps/options, and discipline in AMM pools.
| Metric | What it means | Impact on value |
|---|---|---|
| Depth/spreads | Size at price levels, Bid/Ask difference | Lower execution cost = more attractive to capital |
| Pairs | USDT/USDC/fiat, cross‑chain routes | Easier on/off‑ramps expand the investor base |
| Derivatives | Futures, perps, options | Shape expectations and spill over to spot via arbitrage |
| AMM pools | Liquidity discipline, impermanent loss | Stable pools provide more reliable DeFi pricing |
Thin markets amplify moves in both directions — not always reflecting changes in fundamental value.
Tokenomics: how policy shapes pricing
- Inflation/deflation: high inflation pressures price unless demand grows faster; deflationary mechanisms support price during load.
- Distribution and vesting: concentrated allocations risk post‑unlock sell pressure from large holders.
- Validator/LP incentives: excessive emissions dilute price if demand is not organic.
- Treasury: a strong treasury funds development, but treasury sales can over‑supply the market.
- Token utility: governance, resource access, fee discounts, DeFi collateral — all sustain demand.
Technology: scalability, security, and upgrades
Scalability and fees
Throughput, confirmation time, and gas cost shape user experience. L2s, sharding, and optimizations cut costs and raise readiness for business use, which supports demand for the native token.
Security and incidents
Bridge hacks, protocol exploits, and client bugs repel users and weigh on price. Bounties, audits, and fast patches build trust.
Forks and upgrades matter: fee‑model changes, consensus transitions (e.g., PoS), new transaction types, and privacy features. If an upgrade improves UX and reduces costs, it is a positive driver of value.
Ecosystem and adoption
Value needs a living context: developers, users, institutions, and integrations with payment providers, exchanges, and wallets. Key metrics market participants watch:
- Active addresses, daily transactions, total fees.
- DeFi TVL, number of protocols, and liquidity quality.
- Developer activity: commits, PRs, client releases, roadmaps.
- Enterprise/government pilots and merchant integrations.
When an ecosystem produces working use cases with unit economics, a coin earns a longer demand “runway.”
Regulation and jurisdictions
Regulatory headlines reprice assets fast: approvals of listed products, banking restrictions, taxation, KYC/AML rules, stablecoin frameworks, and actions toward mining. As regulatory uncertainty falls, institutions are more willing to enter, expanding demand and supporting value.
Legal ambiguity not only slows user onboarding — it raises the risk premium and can compress multiples.
Macro drivers: rates, inflation, and liquidity
Crypto increasingly correlates with risk assets. Easy money and low rates fuel risk appetite; abundant USD liquidity often feeds rallies. Tight policy, liquidity crunches, and energy shocks weigh on prices. Inflation expectations can also push investors toward “hard” assets with capped supply.
Information, sentiment, and behavioral effects
FOMO, FUD, social‑media hype, and search trends move prices faster than fundamentals can adjust. In the short run, news dominates models; in the long run, models catch up. Investors monitor fear/greed indices, social tone, retail activity, and positioning of large players.
Speculation and manipulation
- Whales and large wallets: can move thin pairs and trigger liquidation cascades.
- Wash trading and spoofing: manufacture false signals of demand/supply.
- Pump‑and‑dump campaigns: coordinated information pushes followed by concentrated selling at the top.
- Poor DEX liquidity: slippage and sandwich attacks raise the true cost of execution.
Defenses: diversification, limit orders, source verification, and working with reputable liquidity providers.
Valuation: getting closer to “value”
There is no single “P/E” for crypto, but several tools help:
- Network metrics: Metcalfe‑like relationships, active addresses, transaction volume, node counts.
- NVT/NAV/NVTV: market cap versus transaction volume or value created by the network.
- MV = PQ and velocity: tokens as quasi‑money; higher velocity implies lower multiples, all else equal.
- DCF for tokens with cash flows: protocol fees, buybacks, burns, and revenues.
- Comparables: “peer” networks by TVL, TPS, security, and developer traction.
A model is not a crystal ball. Stress‑test assumptions, run sensitivity analysis, and account for market regime.
Case studies: how factors play out
Bitcoin: scarcity and macro
Bitcoin has a hard cap on supply and programmed issuance decay (halvings). Demand tracks macro risk and the “digital gold” narrative. Regulatory clarity and institutional products broaden the investor base.
Ethereum: utility and burns
EIP‑1559 burns a share of fees; the PoS transition lowered issuance and added staking. Demand is driven by the DeFi/NFT/L2 ecosystem; network load affects burn dynamics and price.
Stablecoins: value as a peg
Value = confidence in the peg mechanism, liquidity, and reserve transparency. Risks include delistings, sanctions, counterparty issues, and failures of banking rails.
Gaming tokens and meta‑narratives
Demand depends on real gameplay, reward economics, bot resistance, and the ability to retain users after the hype fades.
Comparative table of value drivers
| Driver group | Example signals | Typical impact |
|---|---|---|
| Supply | Halving, burns, vesting | Lower float supports price (if demand holds) |
| Demand | New use cases, integrations | Broader user base = higher market cap |
| Liquidity | New pairs, market makers | Narrower spreads/slippage = better entry price |
| Technology | L2, security, upgrades | Better UX/reliability = stronger long‑term demand |
| Regulation | Sanctions/approvals | Clarity lowers risk premium; bans pressure price |
| Macro | Rates, inflation | Easy money = risk‑on; tight money = risk‑off |
| Behavior | FOMO/FUD, trends | Short‑term deviations from fundamentals |
Metrics worth tracking
On‑chain
- Active addresses, transactions, average ticket size.
- Fees burned, issuance/emissions.
- Validator count/hashrate/staked share.
Market
- Depth and spreads on key exchanges.
- Perp funding and open interest.
- DEX vs CEX share, TVL of pools.
Behavior/Ecosystem
- Social sentiment, search interest.
- Developer releases, bounties, audits.
- Partnerships, integrations, regulatory news.
Checklist for rational decision‑making
- Decompose the asset into drivers: supply, demand, tech, liquidity, regulation, macro.
- Scenario it: what happens to price if each driver shifts by ±20–50%?
- Use limit orders, start with small tickets, compare true execution cost.
- Follow the calendar: unlocks, upgrades, listings, central‑bank meetings.
- Diversify across narratives and technical risks; keep a liquid stablecoin buffer.
Market regimes: bull, bear, and sideways
In different regimes the same news produces different outcomes. A bull market amplifies positive surprises: capital embraces risk, liquidity appears quickly, and retail joins late, extending the move. Upgrades and new listings often cause not just spikes but extended plateaus as investors buy dips. A bear market inverts the logic: even good news gets sold as participants de‑risk, and liquidity fragments. Value depends more on a project’s “balance‑sheet strength”: long‑run funding, low operating burn, validator stability, and the quality of technical releases. A sideways market is dominated by derivatives; funding and basis steer micro‑narratives, while events lead to short moves and mean reversion.
Practically, adapt horizon and tools: in bulls, “hold and add” strategies dominate; in bears, hedging with options/perps, dollar‑cost‑averaging, and focus on balance‑sheet quality matter more; in ranges, arbitrage and market‑making approaches shine, with spreads, depth, and realized volatility as key dials to watch.
Data sources and monitoring tools
Decisions improve with data: on‑chain analytics (active addresses, transaction volume, holder concentration, exchange in/outflows), market data (order books, volumes, funding, open interest, basis, option greeks), ecosystem signals (client releases, audits, bounties, developer activity), macro (rates, USD liquidity gauges, inflation), and regulatory updates. Build a personal dashboard from multiple sources; pick reputable data providers and cross‑check key indicators. A simple rule of thumb for beginners: if a metric doesn’t affect the network’s ability to produce utility or the ease of entry/exit, its weight is secondary.
Alerts help: large exchange in/outflows, abrupt changes in funding, unusual burn spikes, plus calendar alerts for vestings, listings, and network upgrades. A curated “information diet” reduces the risk of falling for FOMO/FUD.
Risk management and portfolio behavior
No model substitutes for discipline. Position size in volatile assets must match your risk tolerance and time horizon. Define rules in advance: where to trim if news changes fundamentals; how to react to abrupt swings (stops, partial takes); when to revisit assumptions. Remember: a “low fee” is not a “cheap entry” — true cost includes slippage, spreads, network fees, taxes, and the ability to exit immediately.
Smart diversification isn’t just “several coins,” but a mix of distinct sources of value: scarce assets with deflationary issuance, tokens with cash flows, infrastructure coins with network effects, and a “liquidity cushion” in stablecoins. Such a blend hardens a portfolio against failures in specific segments and helps you survive periods of elevated uncertainty.
FAQ: Common questions about crypto value
- Why is price so volatile? Thin markets, derivatives, and news flow create large short‑term deviations.
- What matters more — demand or supply? Both; short‑term markets are more sensitive to liquid float and depth.
- How do halvings work? They reduce new supply; impact depends on expectations and the state of demand/liquidity.
- Does staking affect price? Yes — it lowers circulating float, increasing sensitivity to demand impulses.
- What is the true cost of execution? Quote + spread + service fee + network fees + slippage + withdrawal.
- Why do derivatives “move” spot? Arbitrage and liquidations: funding and futures basis spill over into spot books.
- How to estimate fundamental value? Combine network metrics, DCF for cash‑flowing tokens, and comparables.
- Is burning always good? Only if the network is actually used; otherwise it’s cosmetic.
- How do regulations influence value? Lower uncertainty reduces risk premia and invites institutions.
- Why is stablecoin liquidity important? It simplifies entry/exit, incentivizes market makers, and narrows spreads.
- Is TVL useful? It signals utility and trust in DeFi, but can be inflated by “hot” money.
- Can whales manipulate price? In thin pairs, yes; defenses include diversification, limit orders, and reputable venues.
- How does macro affect different coins? Store‑of‑value assets react to inflation; “tech” coins react to risk cycles and ecosystem growth.
- Should I chase hype? Hype is momentum; without fundamentals, post‑peak drawdowns can be severe.
- What on‑chain data should I watch? Active addresses, volumes, fees, holder concentration, and contract behavior.
- When are options useful? For hedging volatility or event strategies — but they’re more complex than spot/perps.
- Do upgrades move price? If they improve UX or economics; markets often price them in ahead of time.
- What is a “dual‑liquidity market”? When volume splits across CEX and DEX; imbalances create arbitrage windows.
- Can tokens be valued like equities? Partly — if cash flows exist; most tokens reflect network utility, not business equity.
- How to avoid excess risk? Position sizing, stop‑losses, modest leverage, and verified data sources.
Conclusion
Crypto value forms at the intersection of economics, technology, behavior, and policy. In the short run, liquidity and headlines drive markets; in the long run, utility and durable network effects win. To make informed decisions, decompose an asset into drivers, measure their contribution, track key metrics, and practice risk discipline. Markets change — but a data‑driven approach helps you keep calm and keep your capital.